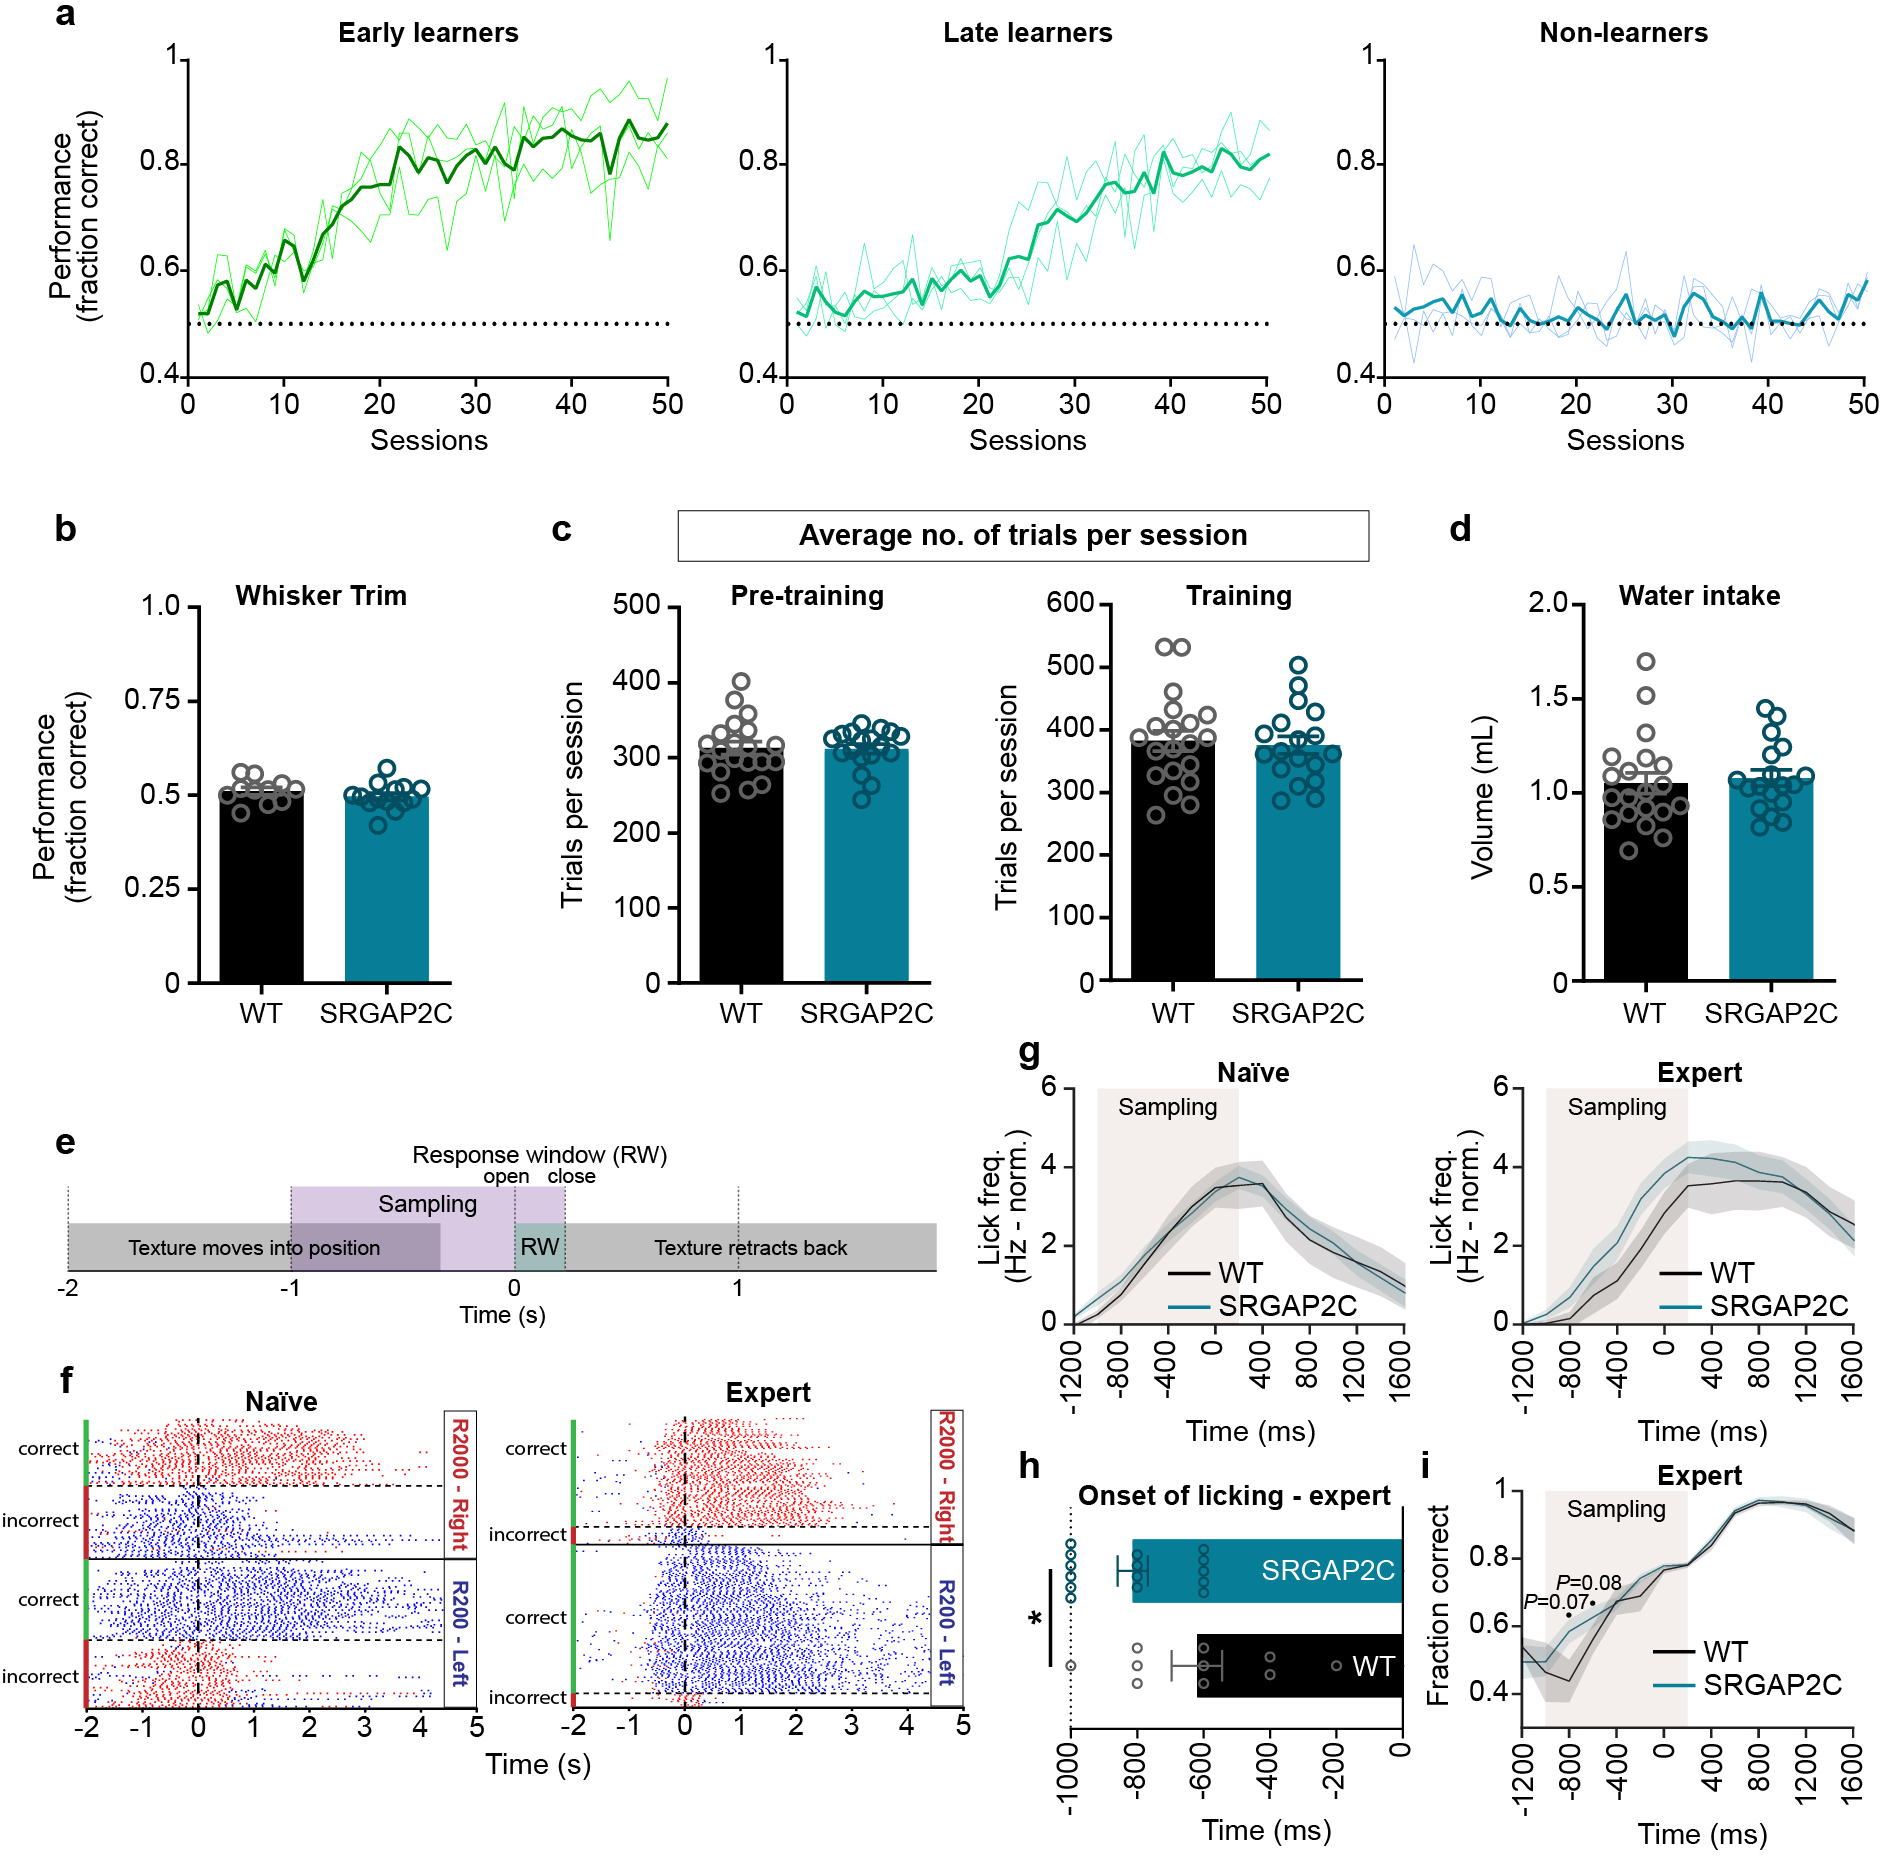
Extended Data Figure 10. Whisker-based texture discrimination task.

(a) Example learning curves (lighter shades) of three individual mice. Mean learning curve is shown in darker shade (b) Performance (fraction correct) after whiskers facing texture were trimmed dropped to chance level, showing that mice needed their whiskers to perform this task (n = 11 for WT and n = 14 for SRGAP2C mice). (c) Average number of trials per session for pre-training and training phase (n = 20 for WT and n = 18 for SRGAP2C mice). (d) Mean water intake per session (n = 20 for WT and n = 18 for SRGAP2C mice). Bar graphs plotted as s.e.m. (e) Schema showing structure of single trial. Textures rotate and move into position 2 s before opening of the response window (RW). Approximately 1 s before RW opening the texture is within reach of the whiskers, allowing mice to sample the texture while it moves further into position. Upon opening of the RW, correct lick responses lead to a water reward, while incorrect lick responses cause to a time-out. Following RW closure the texture retracts back out of reach of the whiskers. (f) Example raster plot of an individual mouse showing the distribution of individual licks (red dot for right licks, blue dot for left licks) relative to opening of the response window before (naïve) and after (expert) learning of the task. Correct licks are either right licks (red) for the R2000 texture, or left licks (blue) for the R200 texture. (g) Lick frequency plot for naïve and expert mice. Lick frequency was normalized for each individual mouse to the mean lick frequency before the sampling window. Shaded area around curves indicates s.e.m. (h) Average timing of licking onset in expert mice relative to opening of the response window (P = 4.91 × 10⁻²; n = 10 for WT and n = 15 for SRGAP2C mice). Bar graph plotted as mean ± s.e.m. *P < 0.05, two-sided Mann-Whitney test. (i) Fraction of licks from expert mice that are correct relative to opening of the response window. Shaded area around curves indicates s.e.m., two-sided Mann-Whitney test.
