
Figure. 2. SRGAP2C expression increases cortical inputs onto layer 2/3 PNs.
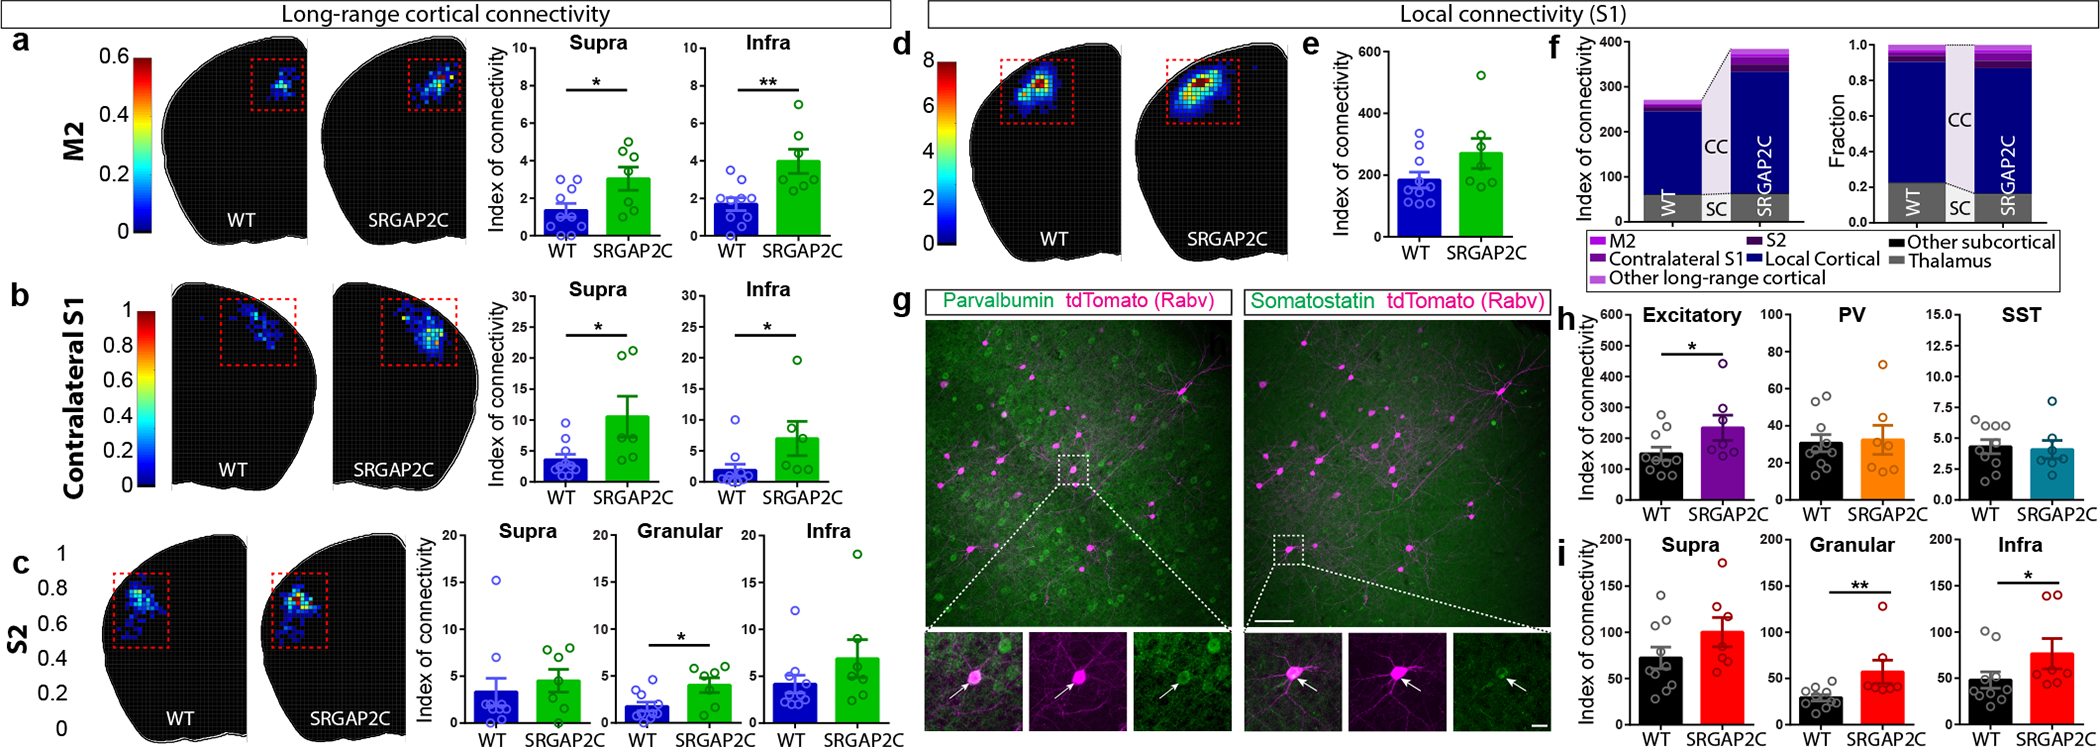
(a-c) Index of connectivity (IOC) for M2, contralateral S1, and S2. Left: distribution of traced neurons. Colors in density plot indicate IOC. Right: IOC. M2: P = 2.99 × 10⁻² for supragranular and P = 4.1 × 10⁻³ for infragranular; Contralateral S1: P = 1.77 × 10⁻² for supragranular and P = 1.39 × 10⁻² for infragranular; S2: P = 2.63 × 10⁻² for granular; two-sided Mann-Whitney test. (d) Distribution of locally traced neurons in S1, colors indicate IOC. (e) IOC for S1. P = 0.109, two-sided Mann-Whitney test. (f) IOC (left) and fraction (right) for all RABV traced inputs, including local cortical inputs originating in S1. (g) Double immunohistochemistry of the same RABV traced brain section for PV (top) and SST (bottom). Bottom panels represent higher magnification of area indicated by dashed boxes. Scale bar large panel, 200 μm. Scale bar small panel, 20 μm. (h) IOC for excitatory, PV-positive, and SST-positive RABV traced neurons in S1. P = 3.3 × 10⁻² for excitatory, two-sided Mann-Whitney test. (i) IOC for excitatory neurons in supragranular, granular, and infragranular layers of S1. P = 6.8 × 10⁻³ and P = 4.31 × 10⁻² for excitatory neurons in the granular and infragranular layer, respectively. Bar graph plotted as mean ± s.e.m. Open circles in bar graphs indicate individual mice (n = 10 for WT and n = 7 for SRGAP2C mice), *P < 0.05, **P < 0.01, two-sided Mann-Whitney test.