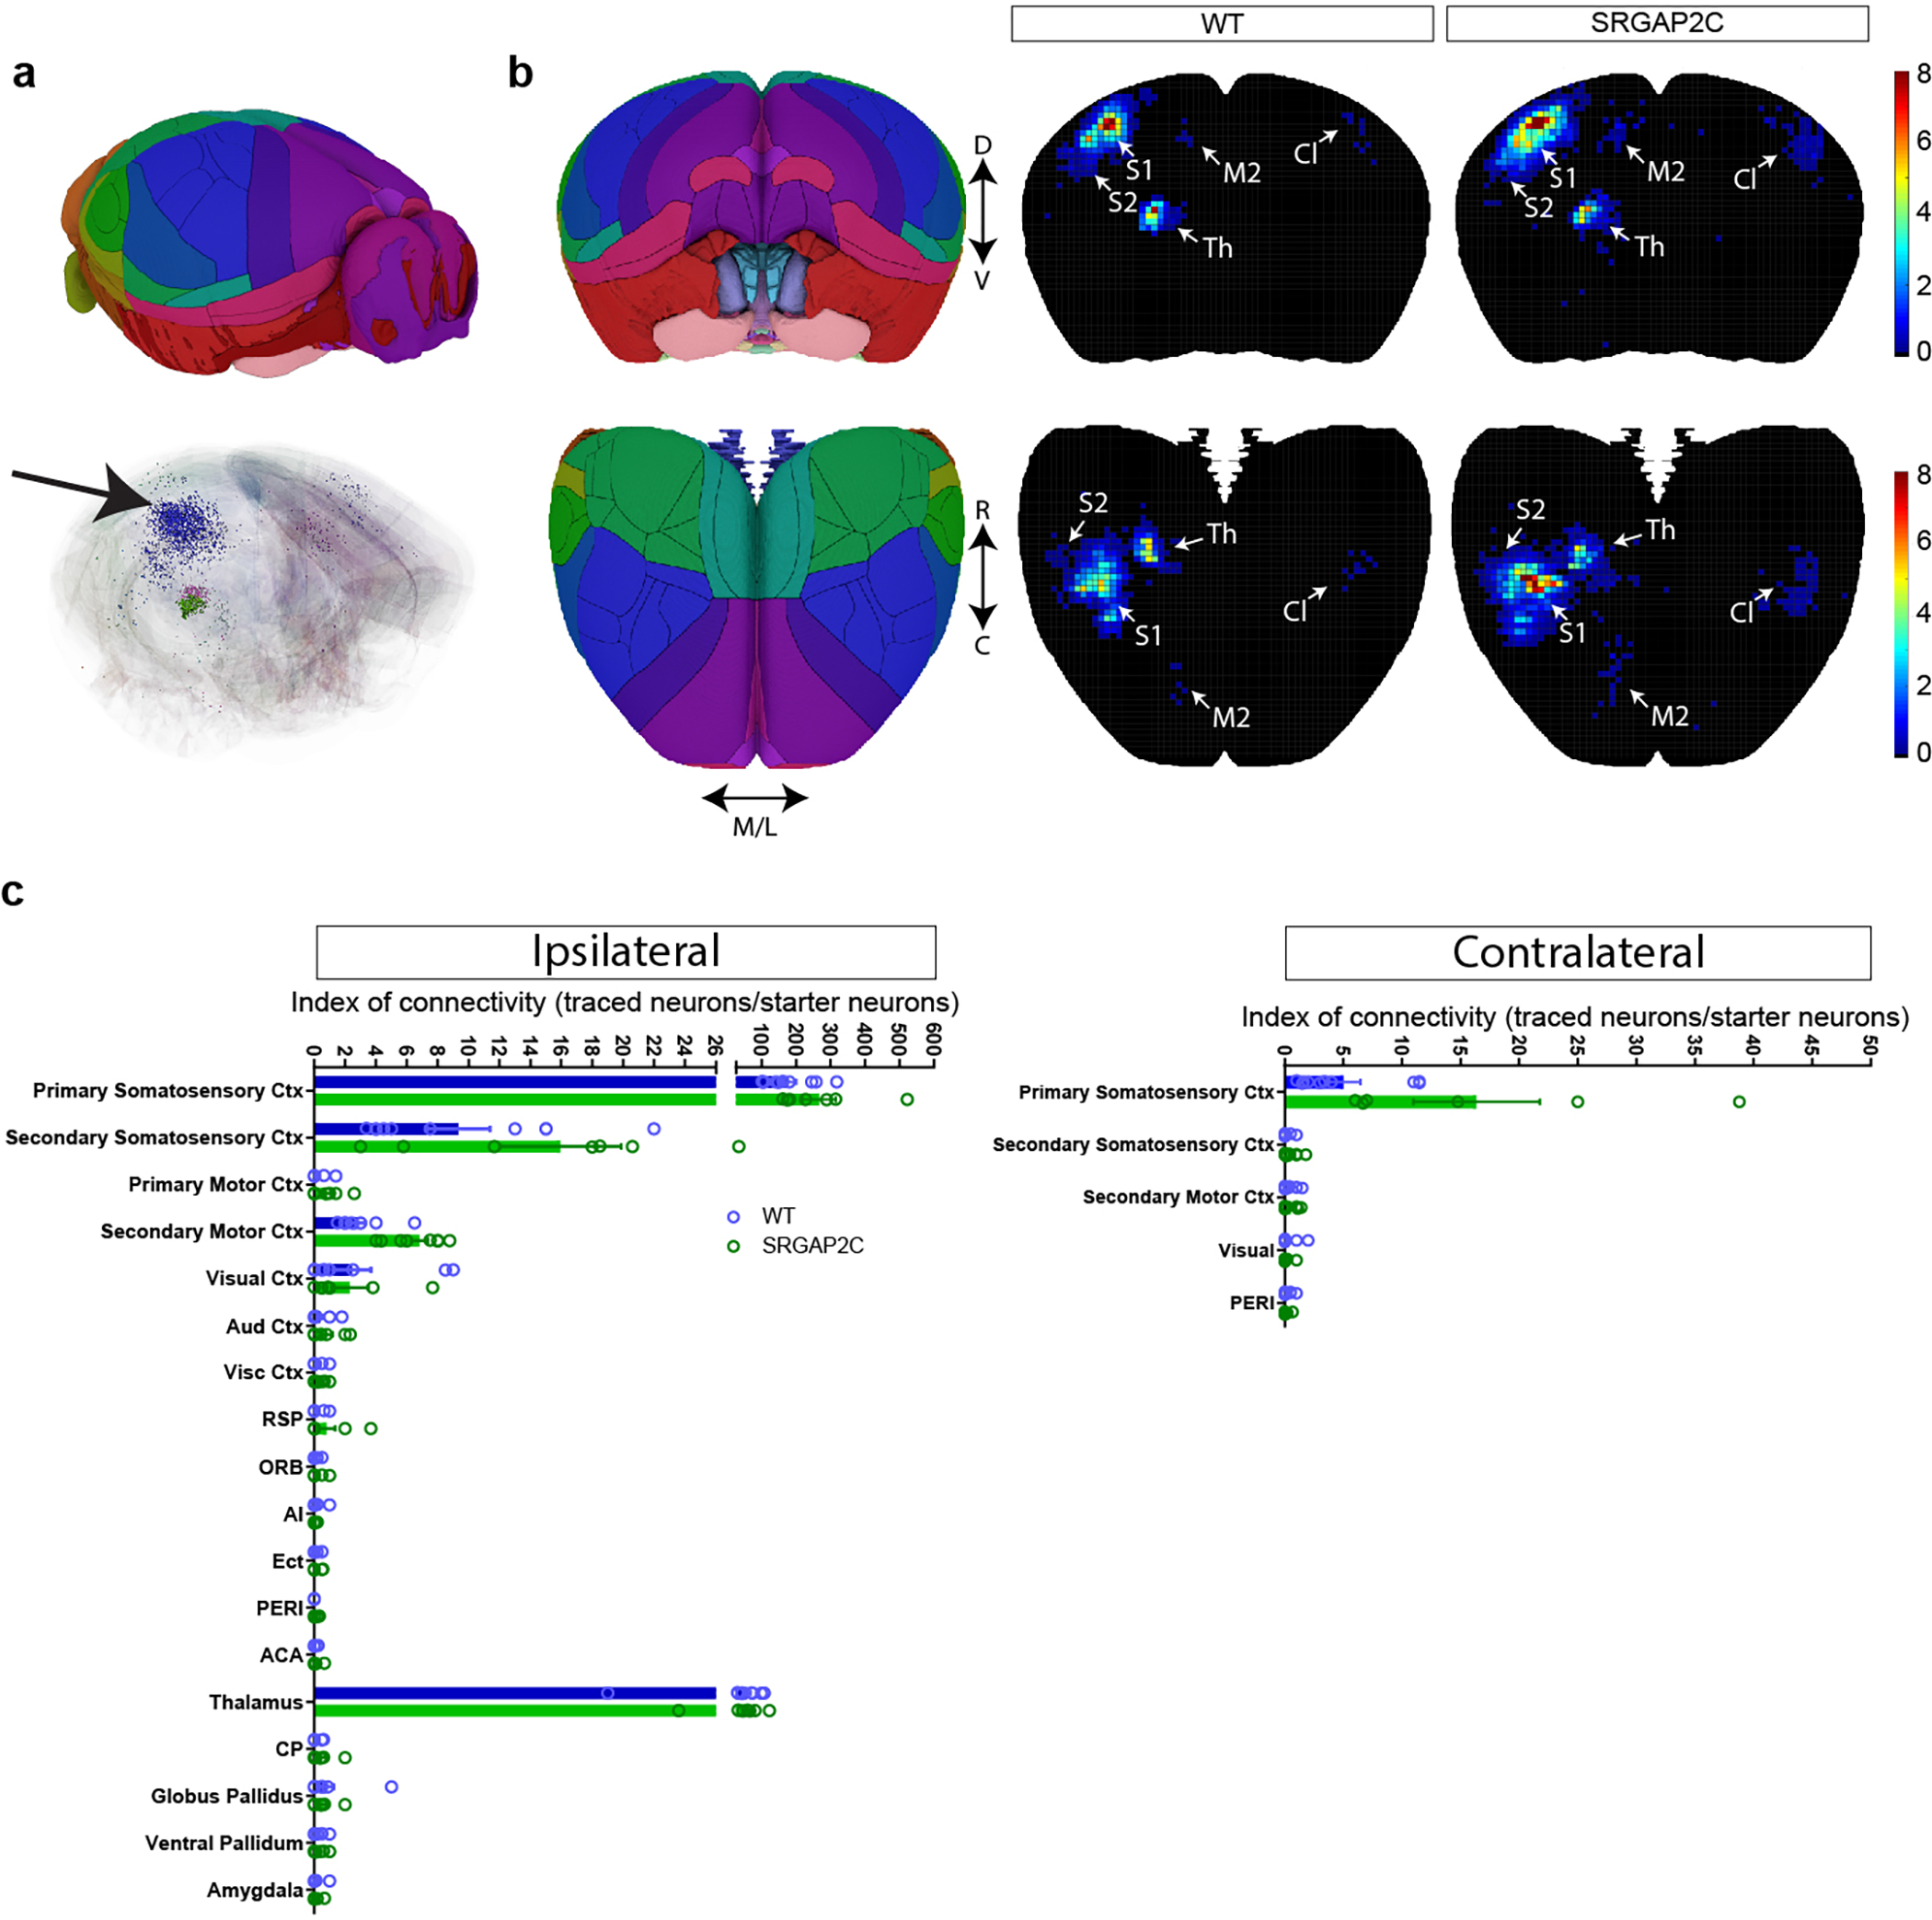
Extended Data Figure 2. Brain regions containing RABV traced neurons.

(a) Reference brain (top) based on Allen Reference Atlas. Digital reconstruction of RABV traced brain and registration onto reference brain. Black arrow indicates location of starter neurons in barrel field of S1. (b) Density plots showing distribution of traced neurons in WT and SRGAP2C mice. Colors in density plot indicate index of connectivity (IOC): number of traced neurons / number of starter neurons). (c) IOC for brain regions ipsilateral and contralateral to the injection site. RSP, retrosplenial area, ORB, Orbital cortex, Ai, Agranular Insular cortex, Ect, Ectorhinal cortex, PERI, Perirhinal cortex, ACA, Anterior Cingulate cortex, CP, Caudate-putamen. Bar graphs plotted as mean ± s.e.m. Open circles in bar graphs indicate individual mice (n = 10 for WT and n = 7 for SRGAP2C mice).
