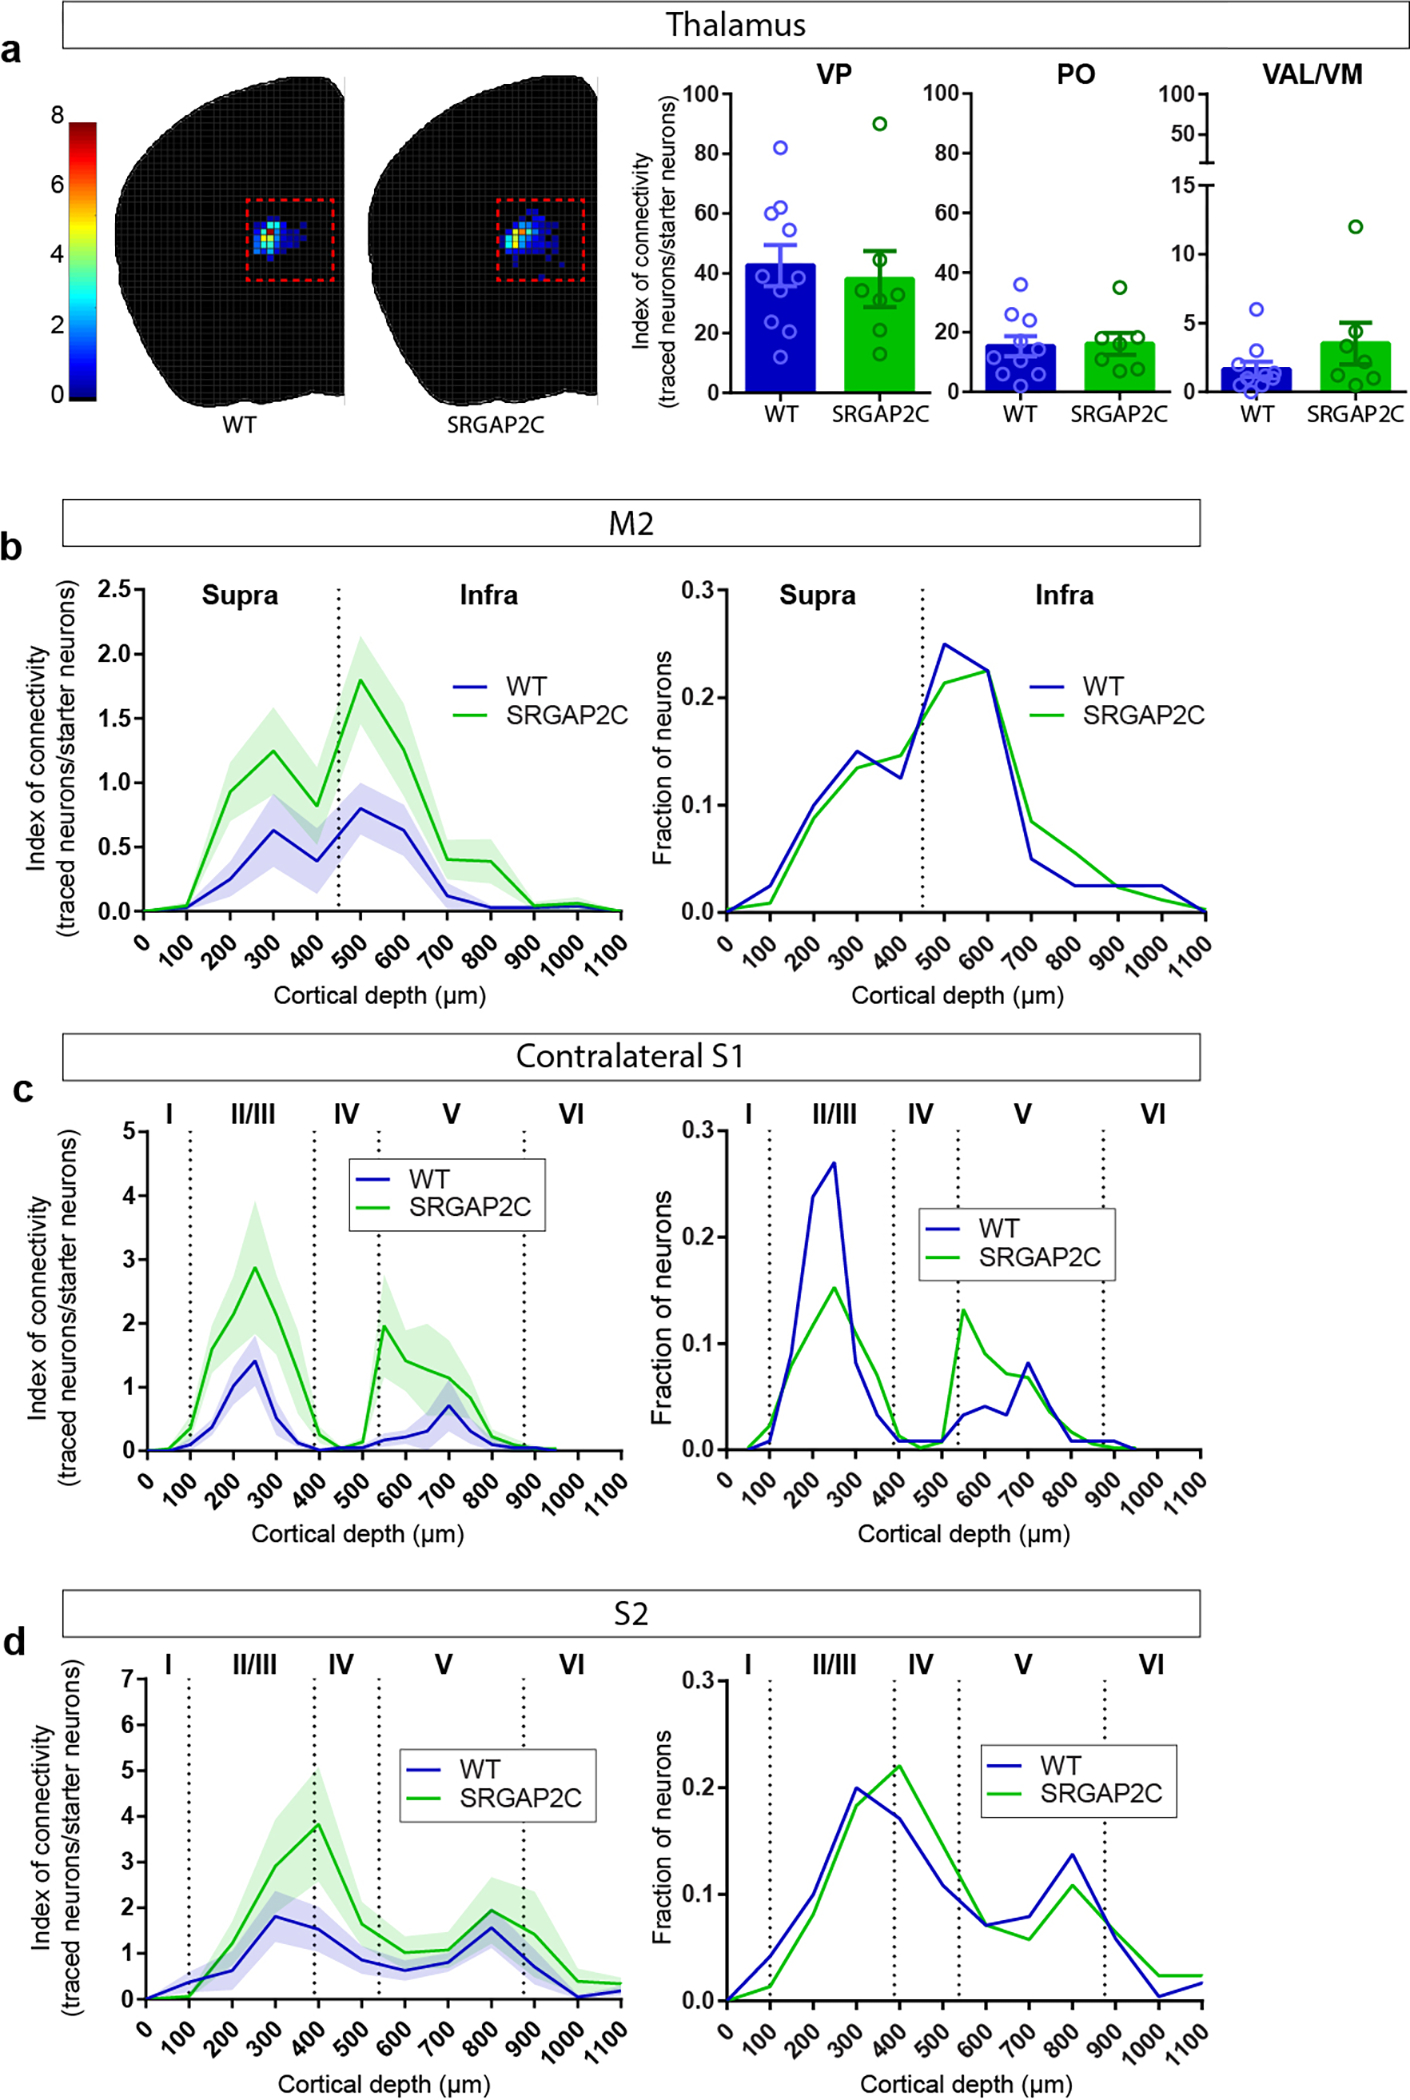
Extended Data Figure 3. Distribution of RABV traced neurons.

(a) Index of connectivity (IOC, number of traced neurons / number of starter neurons) for traced neurons in the thalamus. No difference was observed between WT and SRGAP2C mice (two-sided Mann-Whitney test). Left: distribution of traced neurons in WT and SRGAP2C, colors indicate IOC. Right: IOC for Ventralanteriorlateral/medial (VAL/VM), Ventralposterior (VP), and Posterior (PO) thalamic subnuclei. Bar graphs plotted as mean ± s.e.m. Open circles in bar graphs indicate individual mice (n = 10 for WT and n = 7 for SRGAP2C mice). (b-d) Distribution of traced neurons as a function of their cortical depth. Left: IOC, right: fraction. Shaded area indicates s.e.m.
