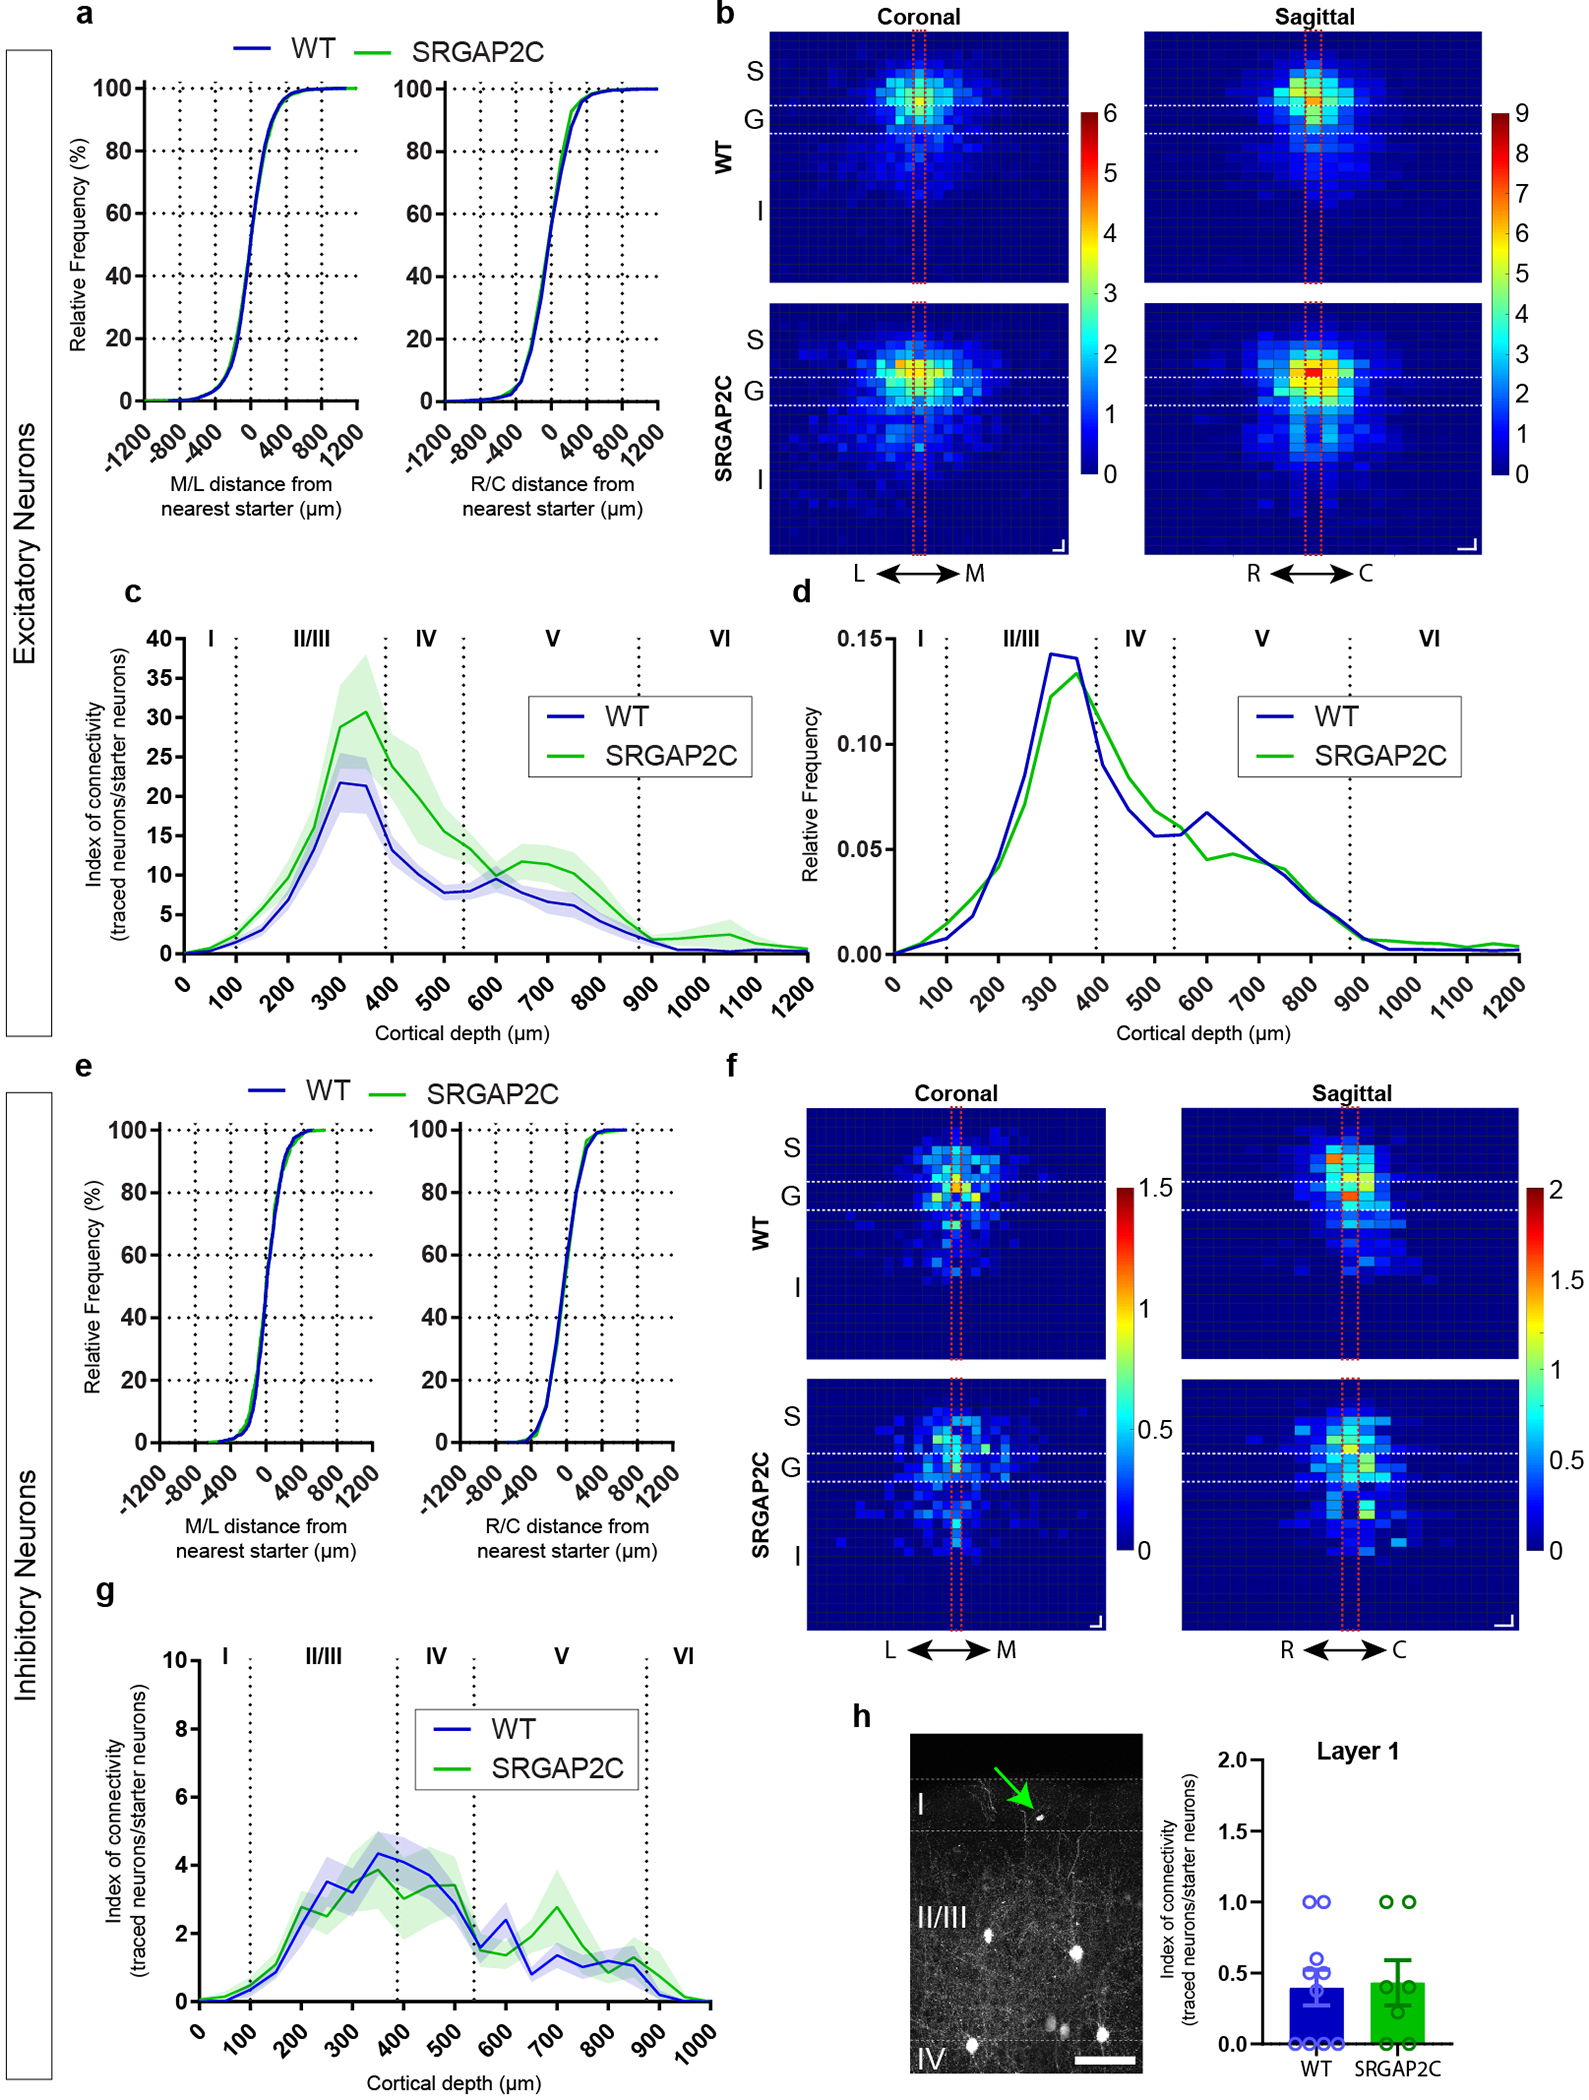
Extended Data Figure 5. Distribution of RABV traced neurons locally in S1.

(a) Distance between RABV traced excitatory neurons in S1 and their closest starter neuron along the medial/lateral (M/L) or rostral/caudal (R/C) plane. No difference was observed between WT and SRGAP2C mice (Kolmogorov-Smirnov test). Data shown as relative frequency distribution. (b) Density plots showing distribution of traced excitatory neurons relative to their closest starter neuron for coronal (left, L and M indicate lateral and medial orientation, respectively) and sagittal view (right, R and C indicate rostral and caudal orientation, respectively). Center bins aligned with relative position of starter neuron are indicated by red dashed lines. S, supragranular, G, granular, I, infragranular layers. For coronal, bin size = 50×50 μm. For sagittal, bin size = 50×100 μm. Colors in density plots indicate IOC. (c) Cortical layer distribution of RABV traced excitatory neurons in S1 shown as Index of connectivity (IOC, number of traced neurons / number of starter neurons). Shaded are indicates s.e.m. (d) Fraction of RABV traced neurons across cortical layers in S1. Dashed lines indicate borders between layers. Roman numbers identify cortical layers. (e) Same as (a), for inhibitory neurons. For analysis of interneurons, Parvalbumin-positive and Somatostatin-positive were grouped together. (f) Same as (b), for inhibitory neurons. (g) Same as in (c), for inhibitory neurons. Shaded are indicates s.e.m. (h) RABV traced neurons in layer 1. Left: Coronal section showing location of a layer 1 traced neuron (green arrow) in the barrel field of the primary sensory cortex (S1). Right: IOC for layer 1 traced neurons. No difference was observed between WT and SRGAP2C mice (Mann-Whitney test). Scale bar, 100 μm. Bar graphs plotted as mean ± s.e.m. Open circles in bar graphs indicate individual mice (n = 10 for WT and n = 7 for SRGAP2C mice).
