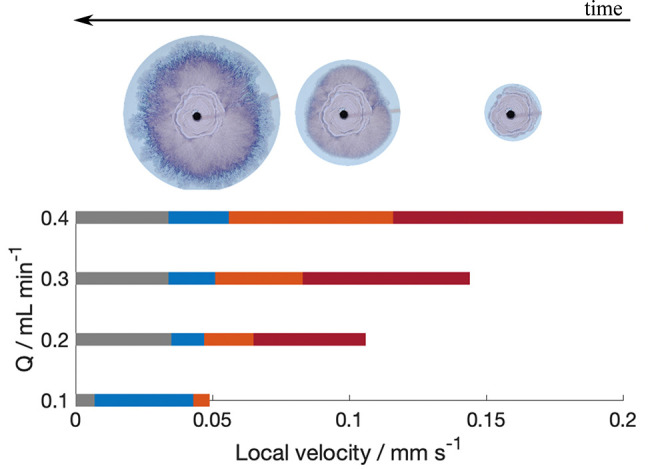
Figure 5.

Pattern regime formed at calculated local velocities for different flow rates. Red bars, Archimedean spirals; orange bars, Candy-floss; and blue bars, lichen/worms regimes. Images above bars also indicate regime pattern. Transition to gray bars signify the end of the experiment.
