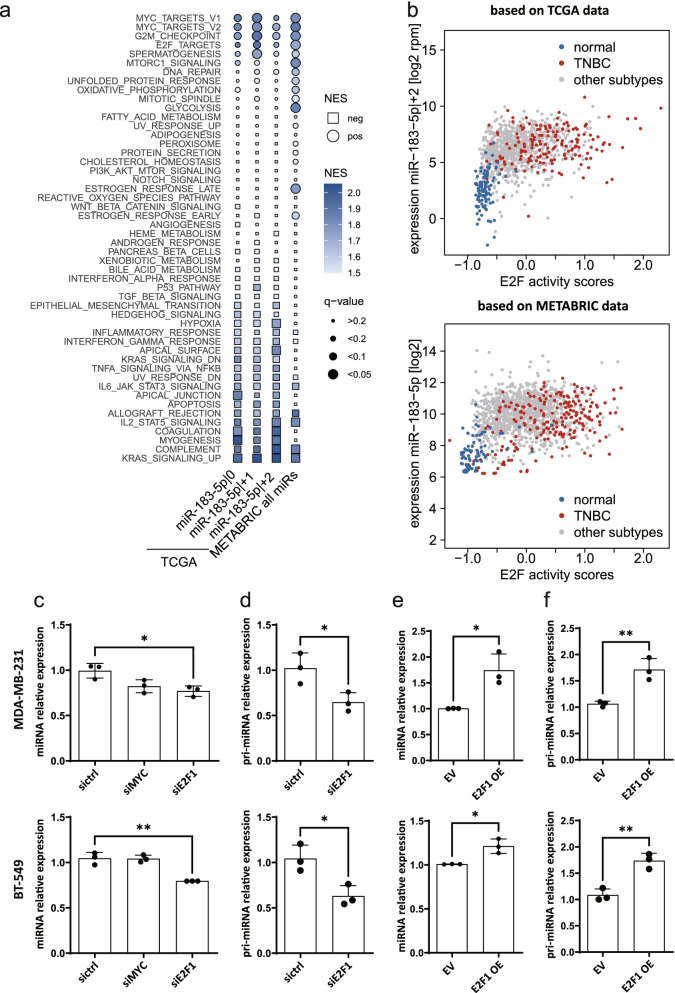
Fig. 7.
Transcriptional pri-miR-183 is regulated by the expression of E2F1. a Gene set enrichment analysis was performed on TCGA mRNA and miRNA sequencing data or METABRIC array-based expression data using the hallmark gene set collection and spearman correlation with the miRNA of interest as ranking metric. Normalized enrichment score (NES) and adjusted p-value of the respective enrichment analysis were visualized in a bubble heatmap. b An E2F activity score was computed for each patient based on the median z-scaled expression of all genes within the E2F target gene set. The relationship of E2F activity score and expression of miR-183-5p|+2 in TCGA or miR-183-5p in METABRIC data are depicted as scatterplots. Samples from normal tissue (blue) and from TNBC patients (red) were highlighted. c-f Downregulation of miR-183-5p and pri-miR-183 by knockdown of E2F1 or overexpression of E2F1. MDA-MB-231 and BT-549 were seeded in 6-well plate for 72 h doxycycline-induction of E2F1 overepression or transfection (siE2F1 or siRNA negative control for 48 h) for knockdown. Total RNA was isolated using miRNeasy Kit (Qiagen). The mature miR-183-5p expression were quantified by miScript miRNA qPCR and normalized to SNORD72 and SNORD95. Normalized expression is depicted as the relative expression to control c, e. The pri-miR-183 expression were quantified by SybrGreen-based RT-qPCR and normalized to housekeeping genes (ACTB and PUM1). Normalized gene expression is depicted as the relative expression to control d, f. Data are presented as mean ± SD, n = 3 (each derived from the median of 3 technical replicates). *p < 0.05, **p < 0.01 compared to control, unpaired t-test

