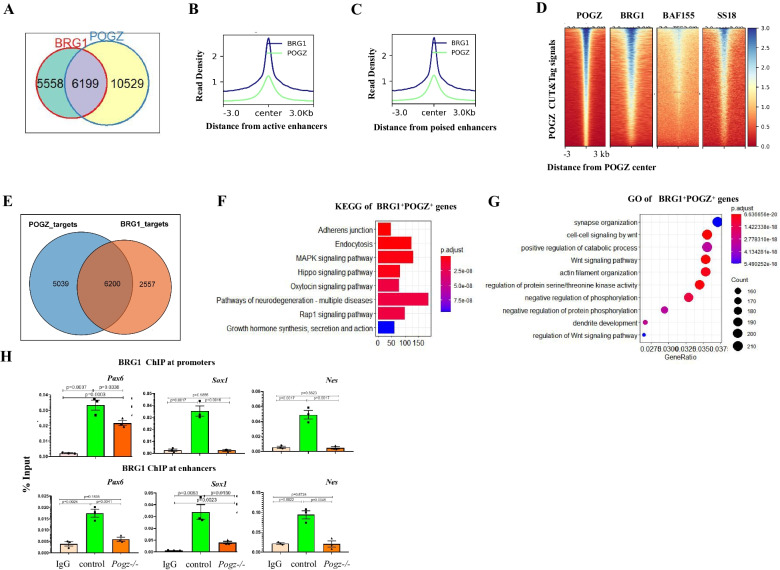
Fig. 5.
POGZ recruits esBAF/BRG1 to neural progenitor genes. A Pie chart showing the overlap of POGZ and BRG1 peaks. B Metaplot of POGZ and BRG1 enrichment (normalized per million mapped reads) across active enhancers (H3K4me1/H3K27ac). C Metaplot of POGZ and BRG1 enrichment (normalized per million mapped reads) across poised enhancers (H3K4me1/H3K27me3). A 6 kb window centered on the peak midpoint was shown. D Heat map view for distribution of POGZ, BRG1, BAF155 and SS18 signals in a ± 3 kb regions across sites bound by POGZ (n = 16,728). E Pie chart showing the overlap of POGZ and BRG1 target genes. F KEGG terms of POGZ+ BRG1+ genes. G GO terms of POGZ+ BRG1+ genes. H ChIP-PCR results showing BRG1 enrichment at promoter and enhancer regions of the indicated genes in day 5 neurospheres from control and Pogz−/− ESCs

