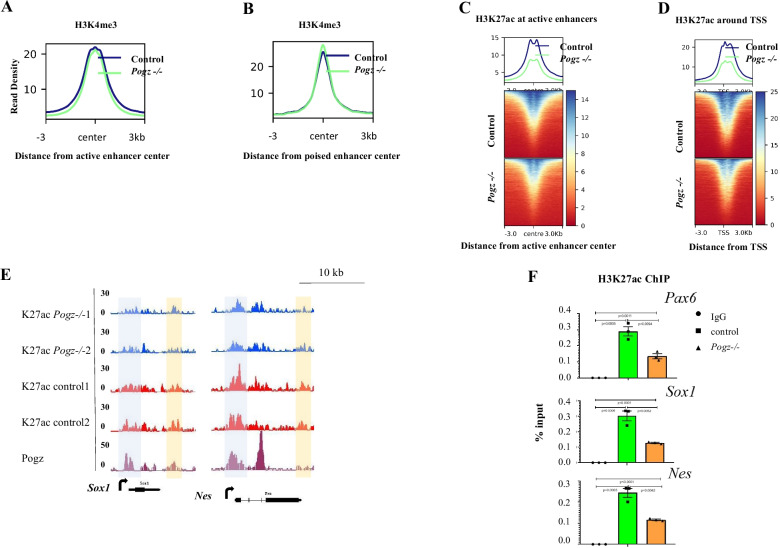
Fig. 7.
POGZ modulates enhancer activities. A Metaplot showing H3K4me3 ChIP-seq density at active enhancer regions in the presence and absence of POGZ. B Metaplot showing H3K4me3 ChIP-seq density at poised enhancer regions in the presence and absence of POGZ. C Up: Metaplot showing H3K27ac ChIP-seq density at active enhancer regions in the presence and absence of POGZ. Bottom: Heat map showing H3K27ac ChIP signals at active enhancers. D Up: Metaplot showing H3K27ac ChIP-seq density around TSS regions in the presence and absence of POGZ. Bottom: Heat map showing H3K27ac ChIP signals around TSS regions. E Snapshots showing H3K27ac ChIP-seq peaks at the indicated genes in control and Pogz−/− ESC-derived neurospheres. Orange: enhancers; Gray: promoters. F ChIP-PCR results showing H3K27ac enrichment at enhancer regions of the indicated neural genes in day 5 control and Pogz−/− ESC-derived neurospheres. ChIP were repeated two times

