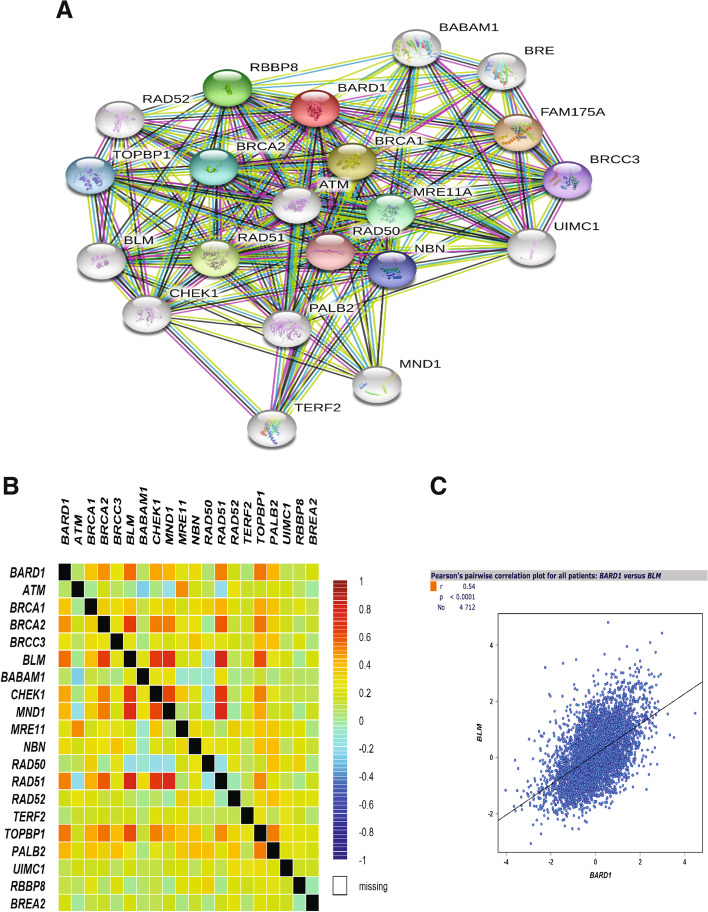
Fig. 6.
Protein-Protein interaction network: A Diagram showing the network of the BARD1 interaction pattern with partners proteins generated by STRING. B The BARD1-Proteins interaction map showing different degrees of correlation strength by bcGenExMiner. C Pearson’s pairwise correlation graph shows high degree of positively correlated interaction between BARD1 and BLM genes, r = 0.54 and P < 0.0001 in breast cancer patients (4712), by bcGenExMiner. Source: Retrieval of Interacting Genes/Proteins database (STRING v10.5) (https://string-db.org/) [59]. Database of The Breast Cancer Gene-Expression Miner v4.8 (bcGenExMiner v4.8) (http://bcgenex.ico.unicancer.fr/BC-GEM/GEM-Accueil.php?js=1) [61]

