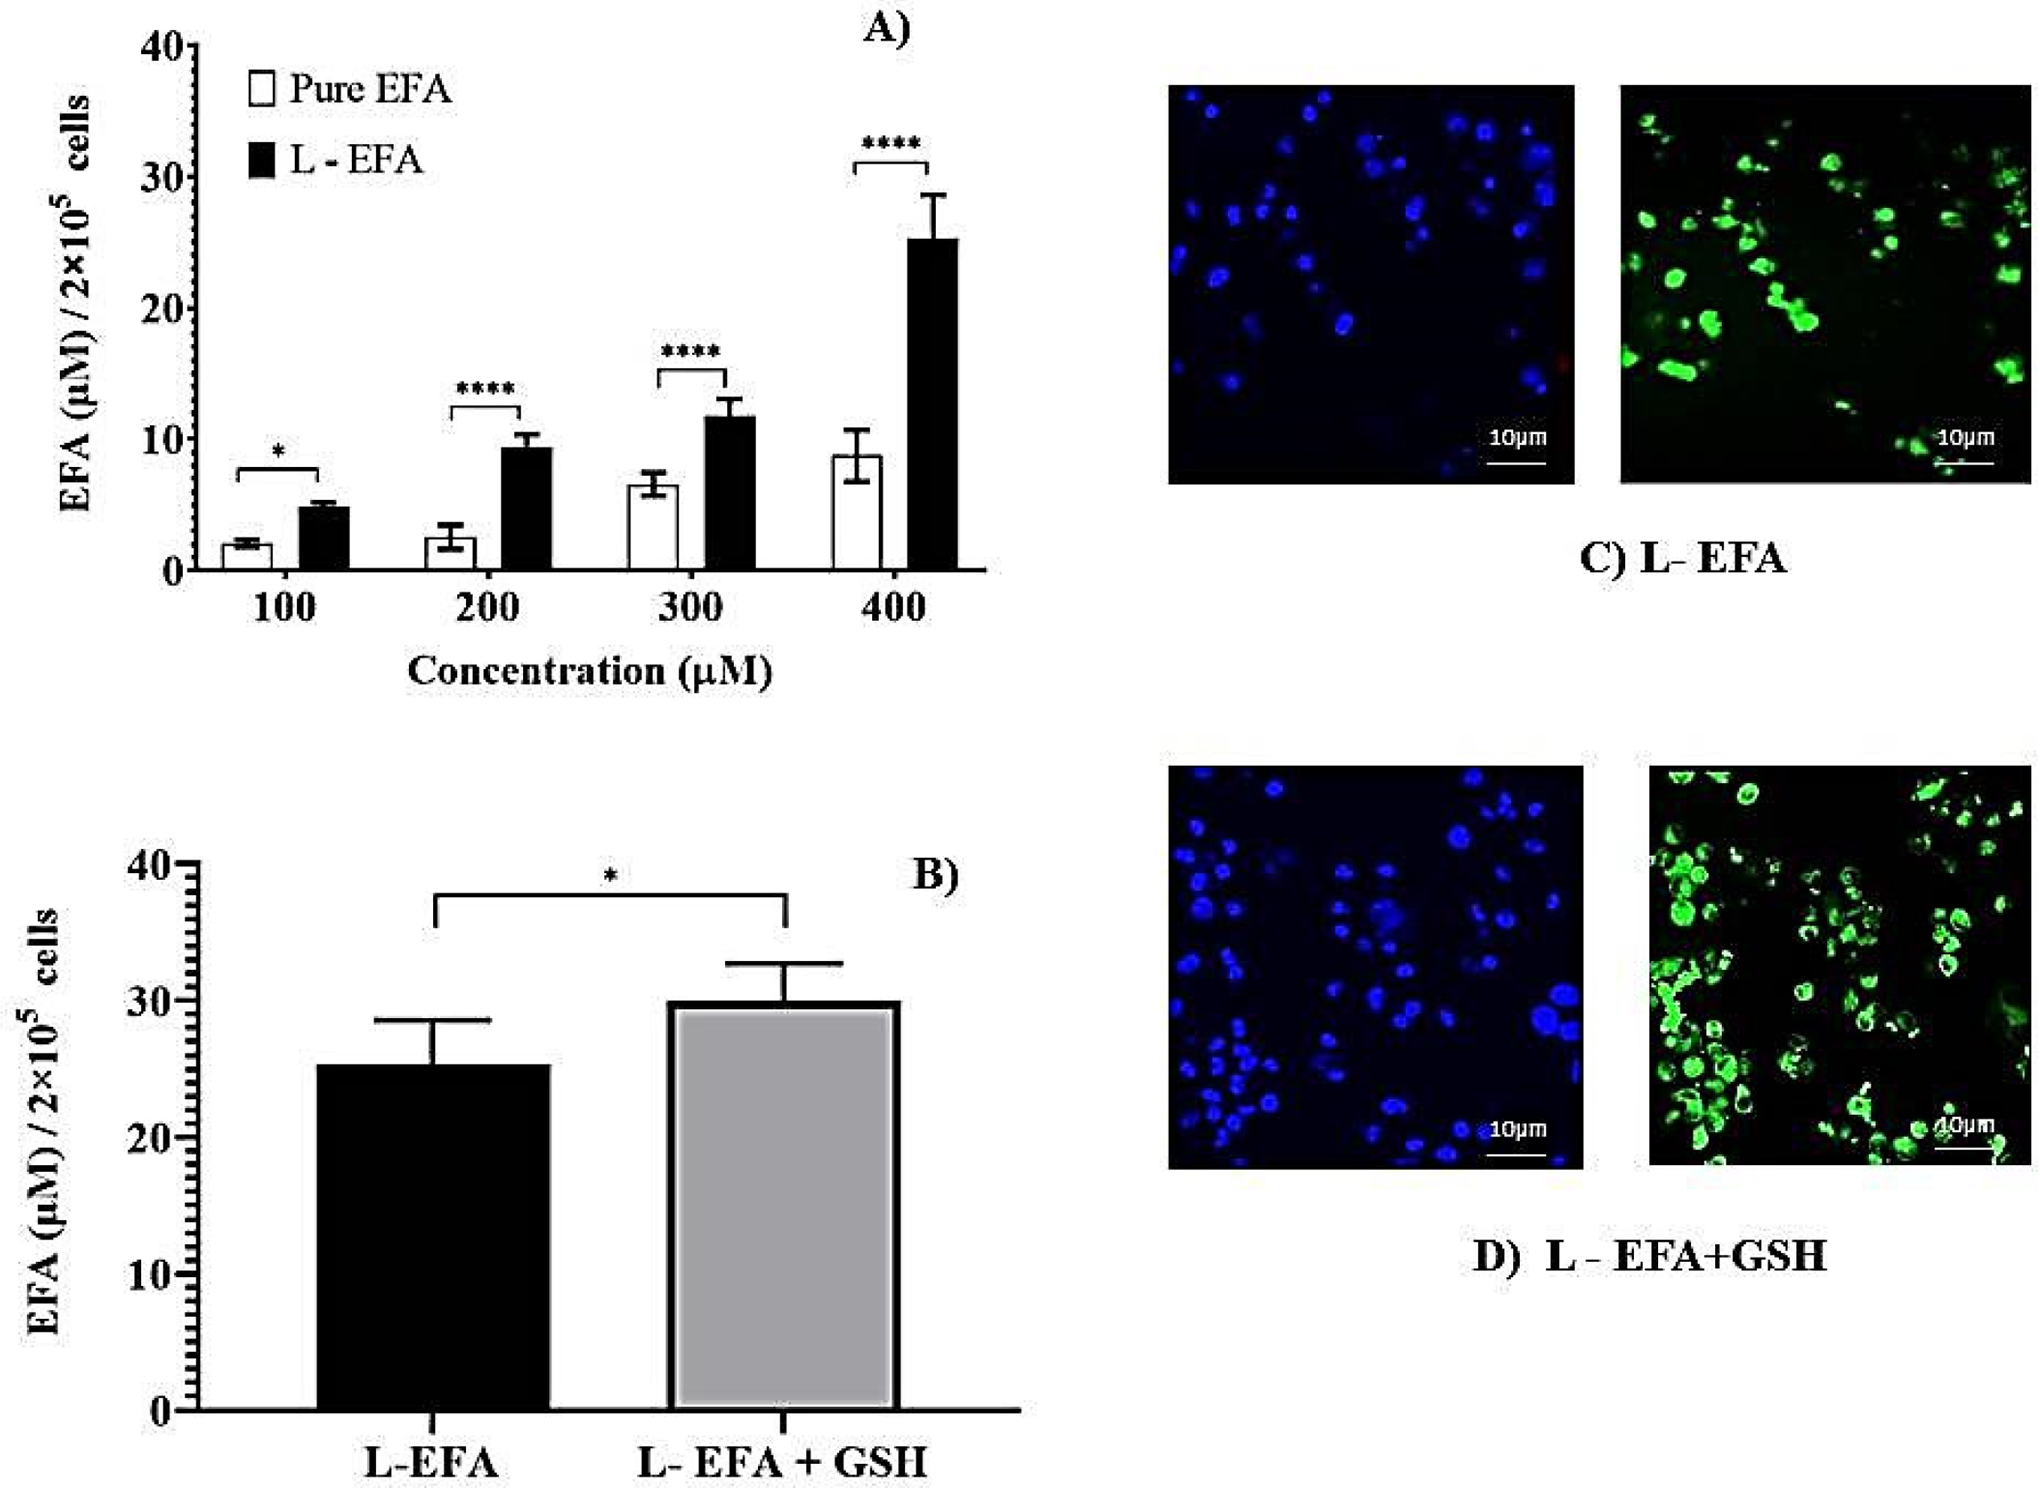
Figure 2.

(A) Intracellular lysate concentrations of pure EFA and liposomal EFA after 24 h at 37 °C incubation of THP-1 monocyte/macrophage cells with liposomal EFA. (A) Intracellular lysate concentrations of EFA with varying concentrations of pure (pure EFA) and liposomal EFA (L-EFA), significant difference between uptake of pure EFA and L-EFA was observed at 200, 300 and 400 μM (**** indicate p < 0.0001). (B) Significant difference between uptake of liposomal EFA with and without GSH was observed (* indicate p < 0.05). Values are means ± S.D. of three independent experiments (C,D) represent the uptake of rhodamine 123-containing liposomal EFA with and without GSH by the THP-1 monocyte/macrophage cells. Cells were incubated with sample preparation for 24 h at 37 °C. Fluorescent images were acquired at ×40 original magnification. Nucleus is stained with DAPI (blue); R123-loaded EFA liposomes shown as green fluorescence.
