Figure 4.

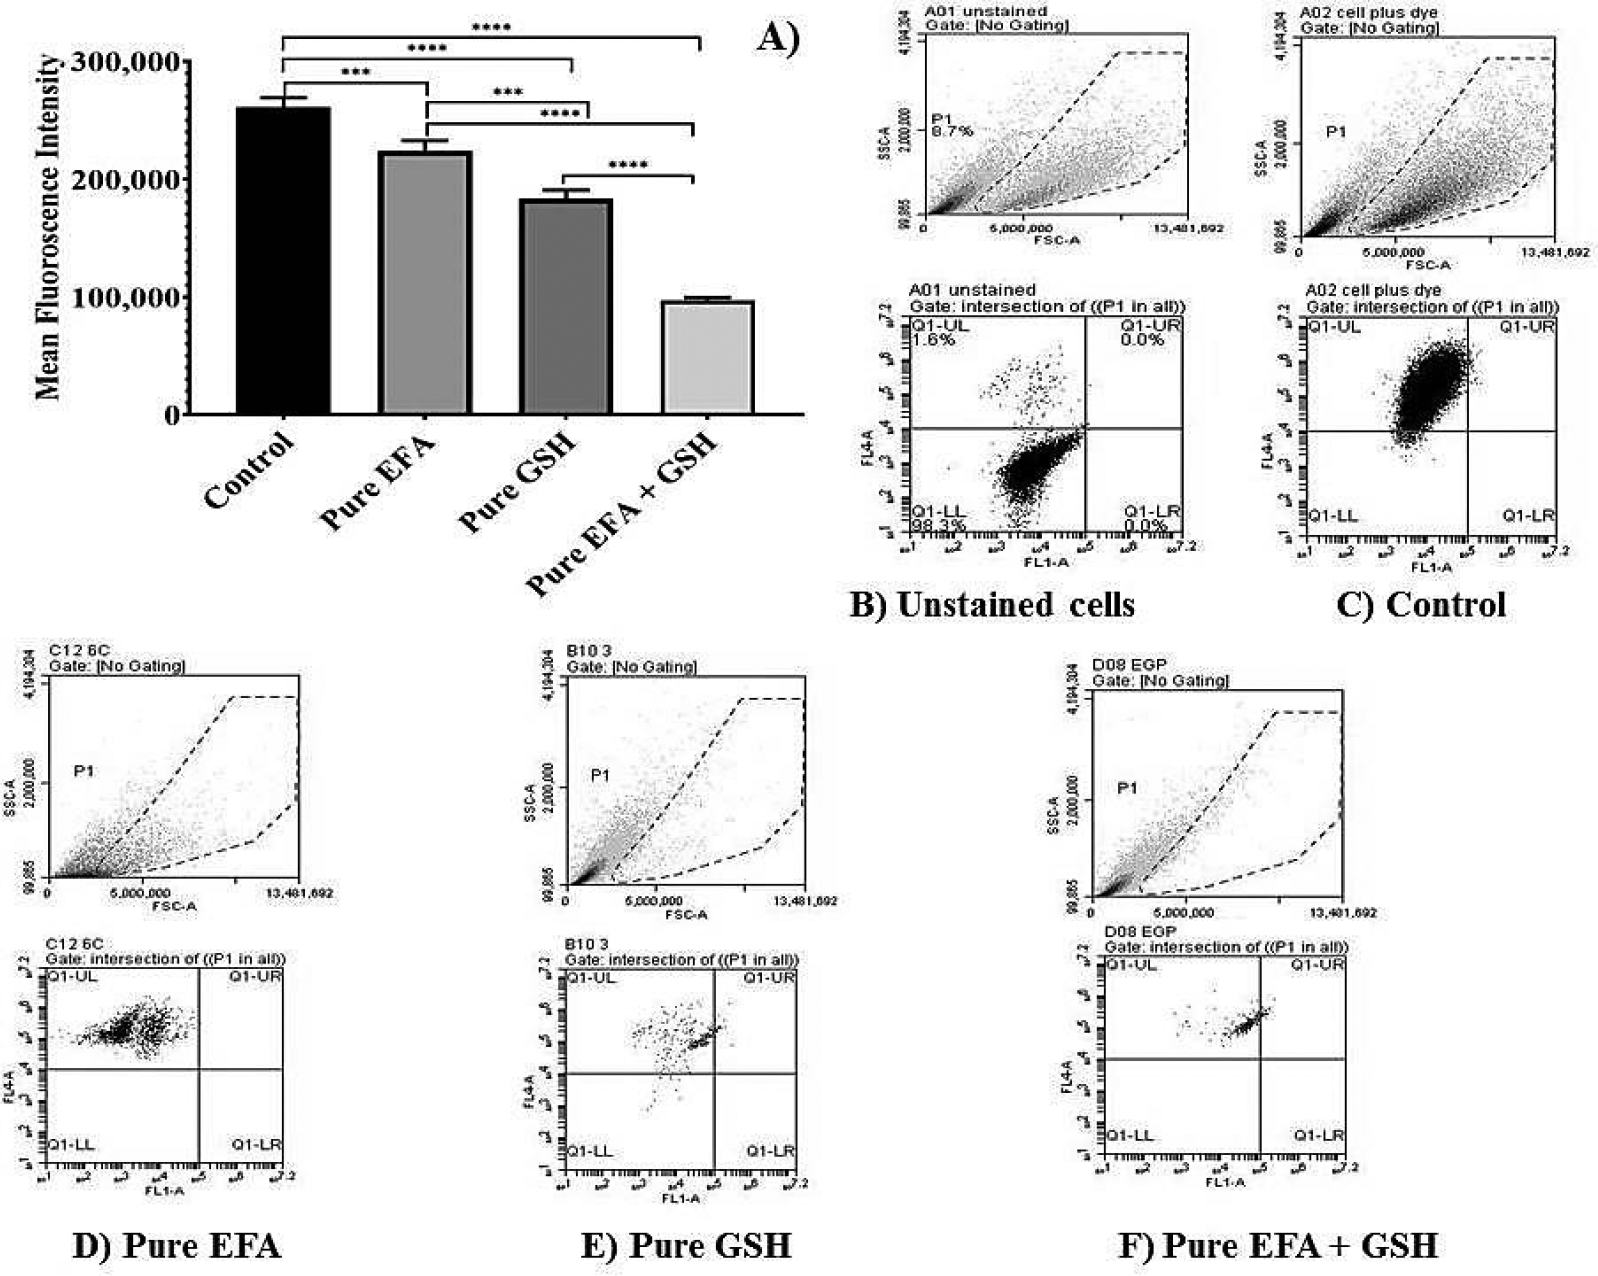
Flow cytometry analysis depicting the measurement of reduction in mean fluorescence intensity (MFI) of PMA-induced oxidative stress in THP-1 monocyte/macrophage cells. (A) Dot plots representing the data of MFI reduction in cells treated with pure efavirenz (EFA) with and without GSH in comparison with pure GSH (**** indicates p < 0.0001; *** indicates p < 0.001).Values are means ± S.D. of three independent experiments. (B–F) represent dot plot of forward scatter to cellROX-derived red fluorescence showing the cellROX gate (gated events) and the below plots represent the dot plot depicting ROS-dependent cellROX fluorescence when cells treated with pure EFA with and without GSH. Untreated cells with no cellROX dye (B); untreated cells with cellROX dye (control—(C)).
