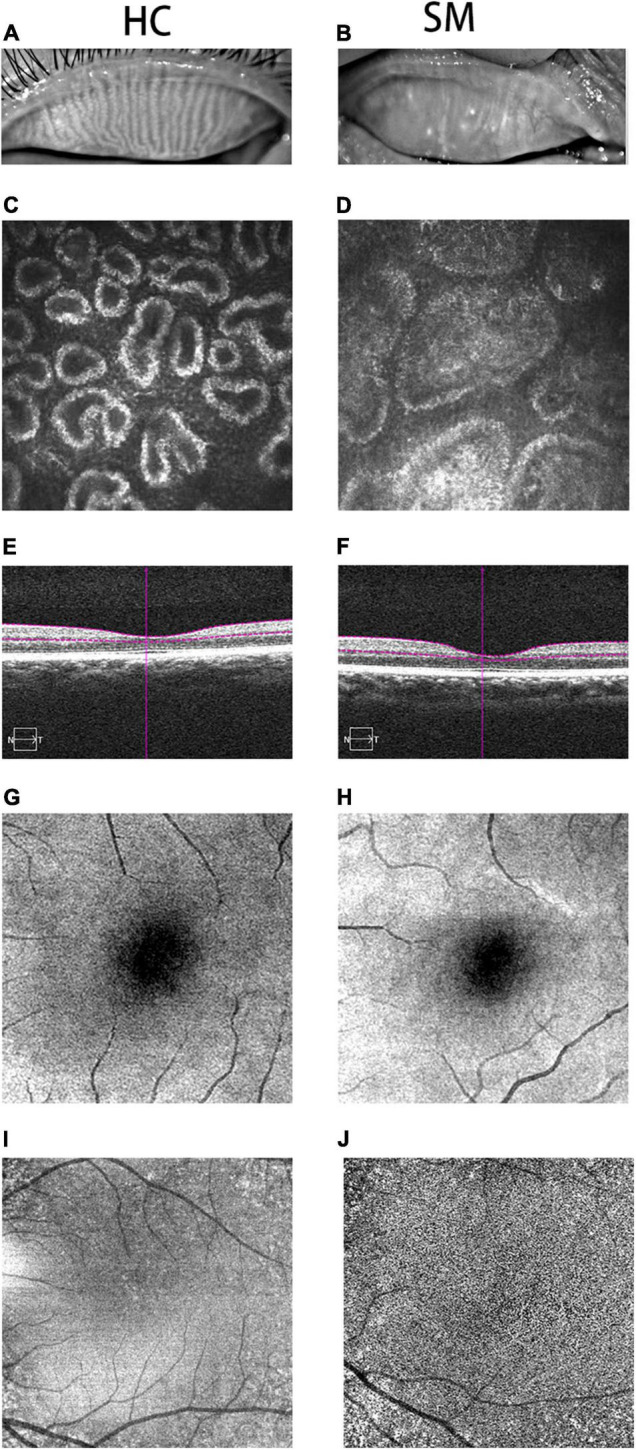
FIGURE 1.

Typical pictures of HC and SM groups. We photographed the changes of MGs in HC group (A) and SM group (B). We can obviously observed that the MG in HC group is clearer than that in SM group. At the same time, we took pictures of the two groups of MGs with corneal confocal microscope, and we could observe the typical differences between the two groups of MGs. The MG in SM group was obviously blocked, and it was widened at the same time (D). Meanwhile, we could observe the normal MG in HC group (C). Therefore, it could be speculated that severe obesity may lead to tarsal gland blockage and degeneration. According to the cross-sectional observation image of retinal thickness in the control group, we could observe that the choroidal thickness in the SM group (F) was significantly thinner than that in the HC group (E). According to the fundus angiography images we obtained, we also observed that the capillaries in HC group (G,I) were more developed than those in SM group (H,J), indicating that severe obesity may reduce the thickness of choroid and fundus blood supply, and may further cause fundus disease. HCs, healthy controls; SM, severe obesity and meibomian gland dysfunction; MG, meibomian gland.
