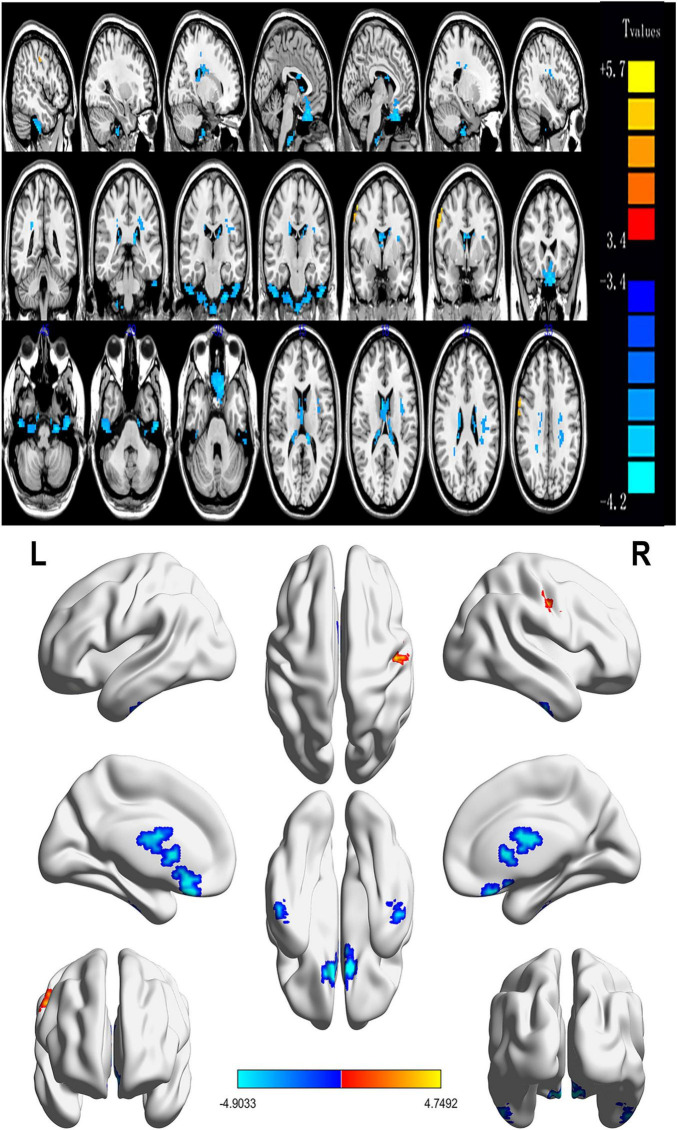
FIGURE 2.
Spontaneous brain activity in patients with severe obesity and meibomian gland dysfunction. Red regions (left cerebellum, right fusiform gyrus, left inferior temporal gyrus, left rectus gyrus, right thalamus, right caudate, left insula, and left thalamus) indicate higher ReHo values, while blue regions (right middle frontal gyrus) represent lower ReHo values (P < 0.05; AlphaSim-corrected; cluster size, >40). ReHo, regional homogeneity; R, right; L, left.

