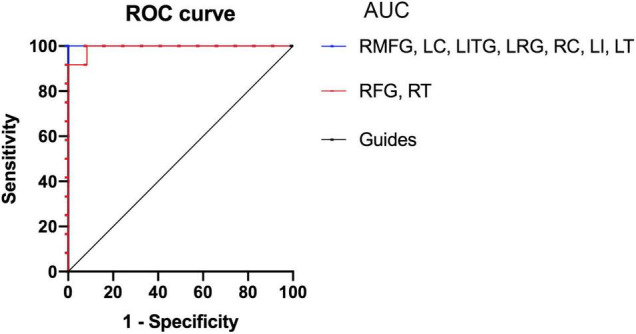
FIGURE 5.

Receiver operating characteristic curve analysis of the mean ReHo values for altered brain regions. The areas under the ROC curve were 1.000 (P < 0.001; 95% CI: 1.000–1.000) for the RMFG, LC, LITG, LRG, RC, LI, LT; 0.993 (P < 0.001; 95% CI: 0.971–1.000) for the RFG, RT (SMs < HCs). HCs, healthy controls; SM, severe obesity and meibomian gland dysfunction; ReHo, regional homogeneity; ROC, receiver operating characteristic; AUC, area under curve; RMFG, right middle frontal gyrus; LC, left cerebellum; RFG, right fusiform gyrus; LITG, left inferior temporal gyrus; LRC, left rectus gyrus; RT, right thalamus; RC, right caudate; LI, left insula; LT, left thalamus.
