FIGURE 6.

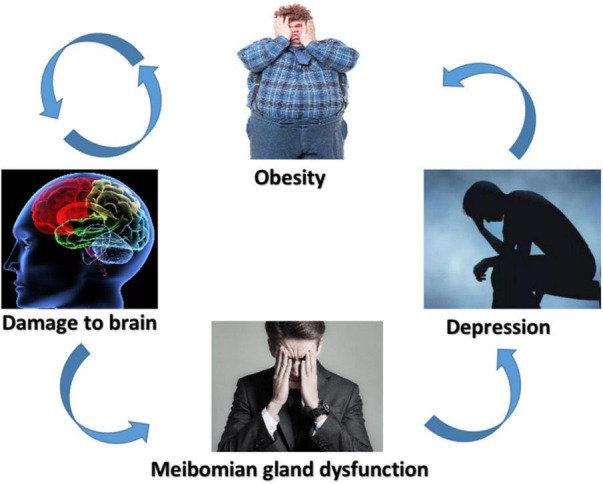
Schematic diagram of the relationship between SM, brain damage, MGD, and depression. SM, severe obesity and meibomian gland dysfunction; MGD, meibomian gland dysfunction.

Schematic diagram of the relationship between SM, brain damage, MGD, and depression. SM, severe obesity and meibomian gland dysfunction; MGD, meibomian gland dysfunction.