
Fig. 3.
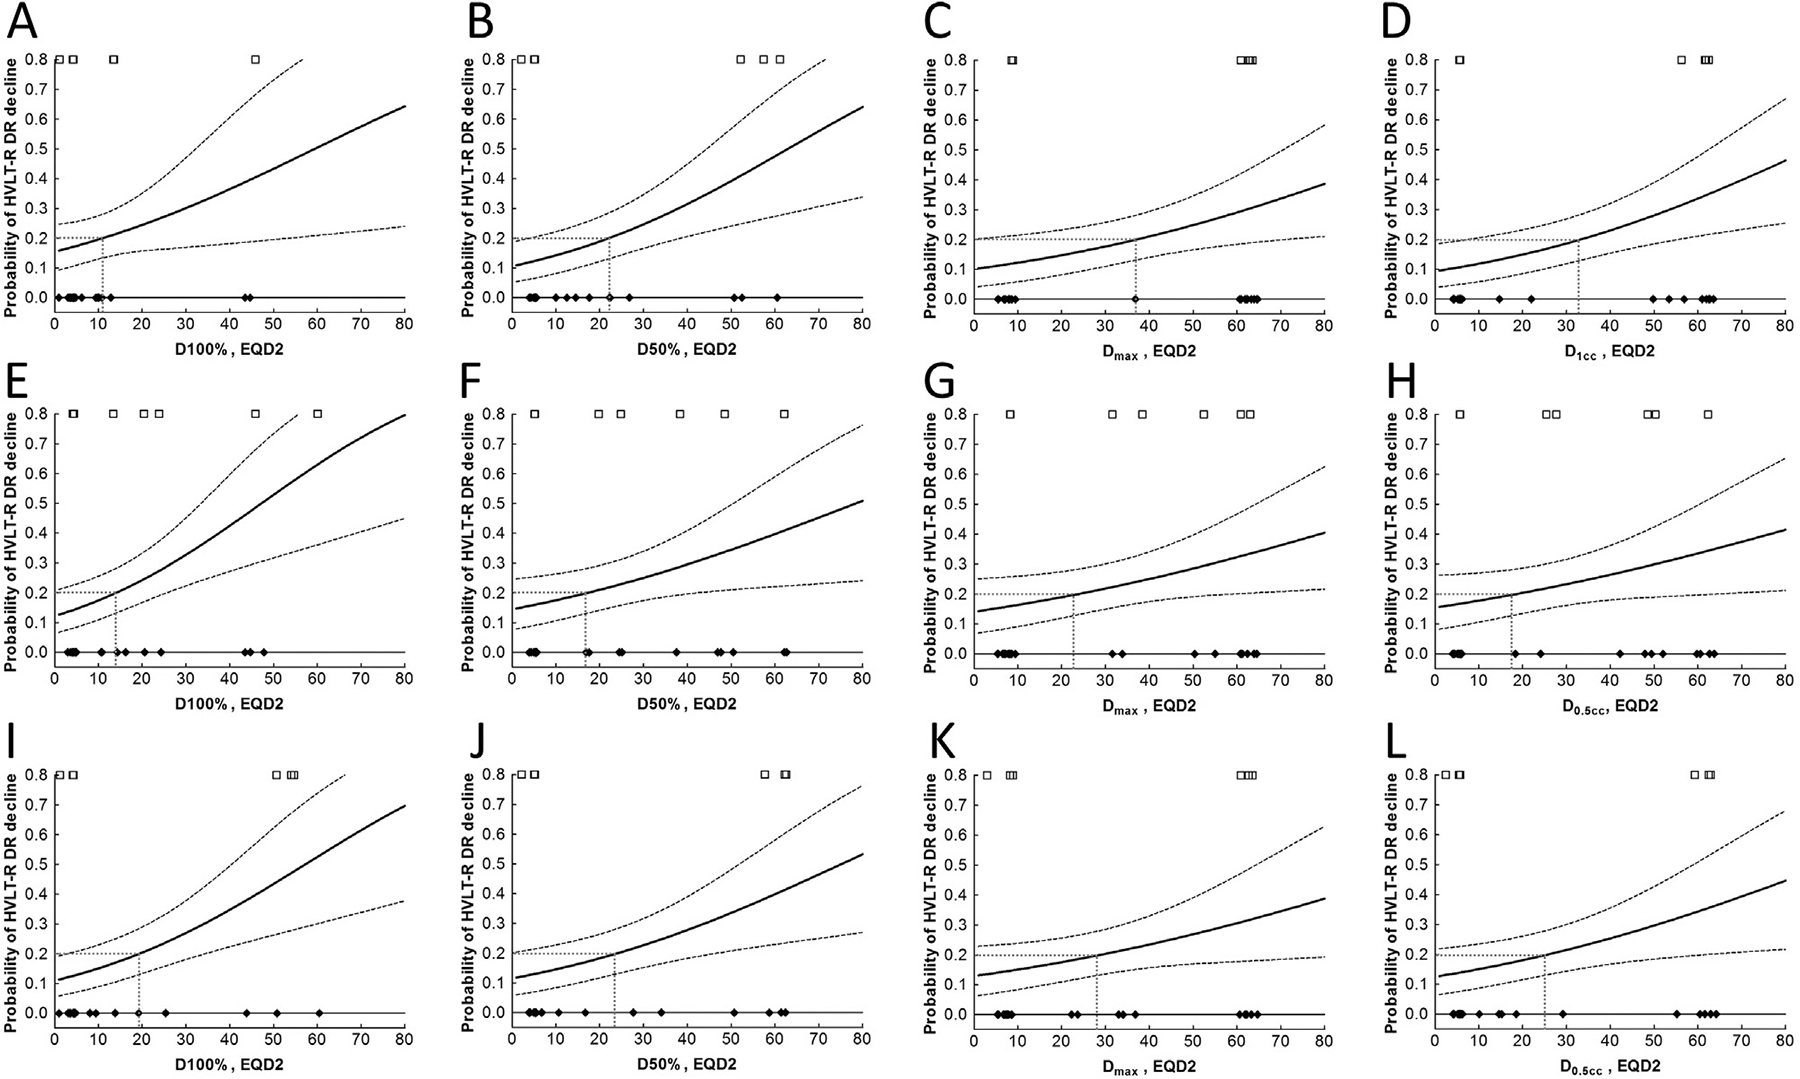
Dose-response relationship between EQD2 to various volumes of bilateral hippocampi (A–D), left hippocampus (E–H) and right hippocampus (I–L) and decline of HVLT-R DR at 6 months. Cases with HVLT-R DR decline were plotted as open squares and cases without HVLT-R DR decline as filled diamonds, the logistic model as the solid line, the 20% risk levels as dotted lines, and the 68% confidence interval as dashed lines.