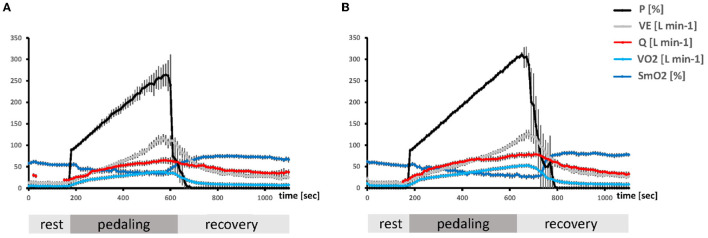
Figure 1.
Timeline of the average metabolic alterations during the ramp test. Composite line graphs visualizing the mean + SE over 10-s-intervals of the ramp exercise test for selected parameters characterizing aerobic metabolism and PO in unfit (A) and aerobically fit (B) subjects. Values during the pedaling phase were scaled to the respective average duration during which subjects were able to resist voluntary exhaustion. The Y-axes indicate the numerical values for each parameter.

