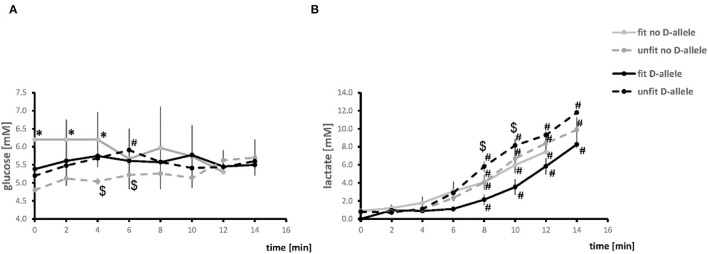
Figure 2.
Timeline of alterations of blood metabolites during the pedaling phase of exercise test. Line graph visualizing the mean values of glucose (A) and lactate (B) concentration in blood during the pedaling phase of exercise. #p < 0.05 vs. 0 min, *p < 0.05 vs. unfit, same genotype. $p < 0.05 vs. other genotype, same fitness state. Note, the time to exhaustion was two min shorter for the fit D-allele non-carriers, because the all-male group had a steeper ramp protocol.

