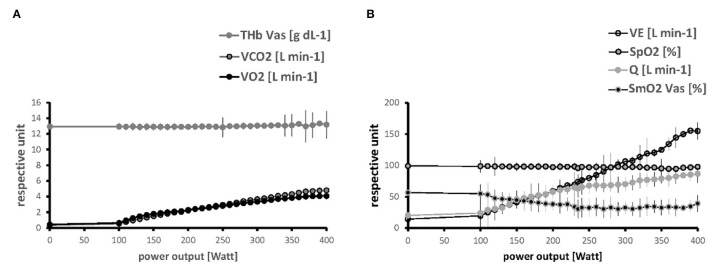
Figure 3.
Linearity of relationships between metabolic parameters and power output. Line graphs visualizing the progression of values for parameters of the pathway of oxygen respective to PO during the work phase of the ramp test, for THb, VCO2 and VO2 (A) and VE, SmO2, SpO2 and Q (B). Values are shown up to a maxima of 400 Watts when most subjects ceased pedaling. Symbols and vertical lines indicate mean + SD of values at an imposed PO in the studied 19 male subjects.

