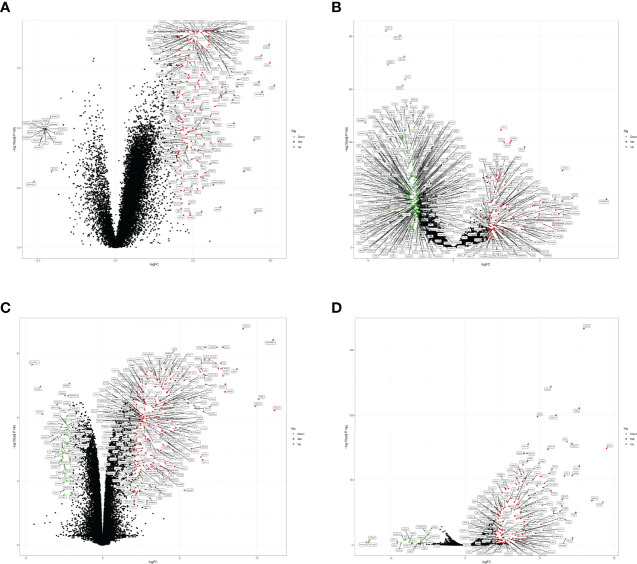
Figure 2.
DEGs of COVID-19 and EHF. (A) Volcano plot of DEGs from the GSE157103 dataset. (B) Volcano plot of the DEGs from the GSE152075 dataset. (C) Volcano plot of DEGs from the GSE86282 dataset. (D) Volcano plot of the DEGs from the GSE133751 dataset. Red dots represented up-regulated genes in COVID-19 or EHF patients, and green dots represented down-regulated genes in COVID-19 or EHF patients (FDR<0.05 and absolute value of log(FC) > 2.

