Figure 5.
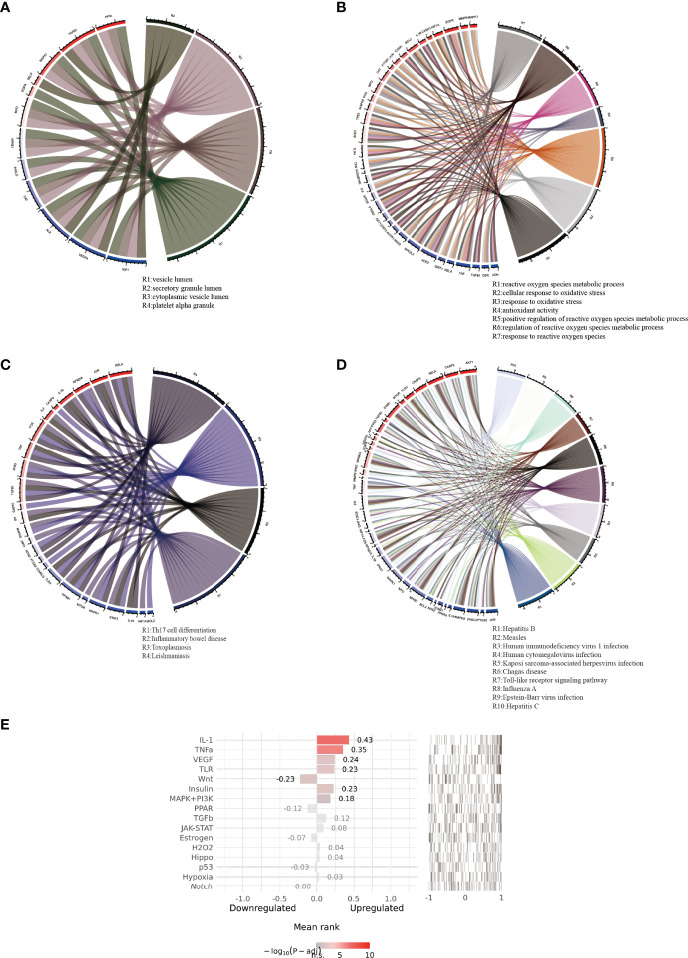
Pathways with high correlation and corresponding common genes. (A, B) respectively displayed the highly correlated pathways and corresponding common genes of GO term rich base results. (C, D) displayed the highly correlated pathways and corresponding common genes of KEGG pathway enrichment results. (E) displayed the results of upstream pathway activity analysis for 69 common genes.

