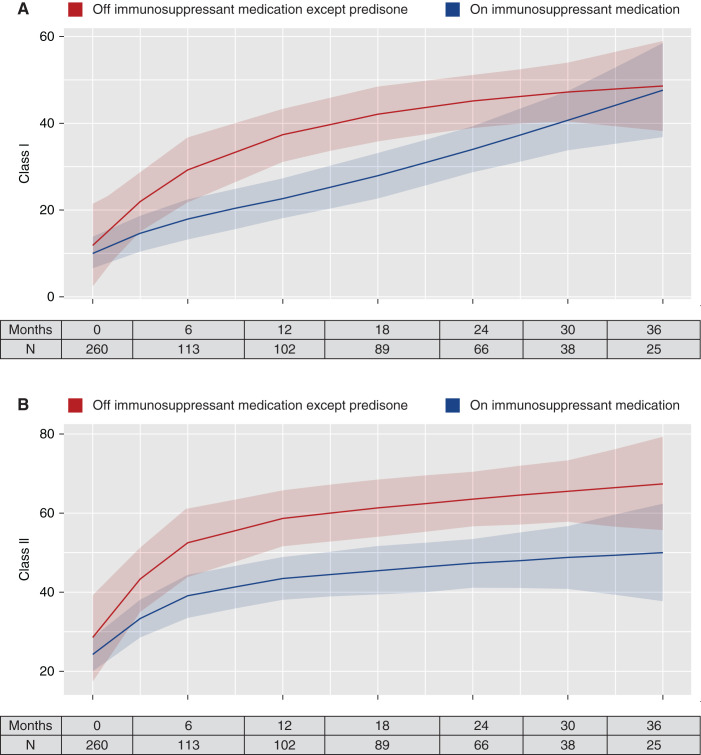
Figure 4.
Temporal change in PRAs for those who discontinued all immunosuppressants except low-dose prednisone. (A) Class I PRAs; (B) class II PRAs. Solid lines represent the predicted PRA level at the time point in the x axis, estimated using nonparametric spline regression using the restricted maximum likelihood criteria with two quantile-spaced knots. The shaded areas are 95% CIs. The tables represent the number of patients who had a value at the time point in the x axis.

