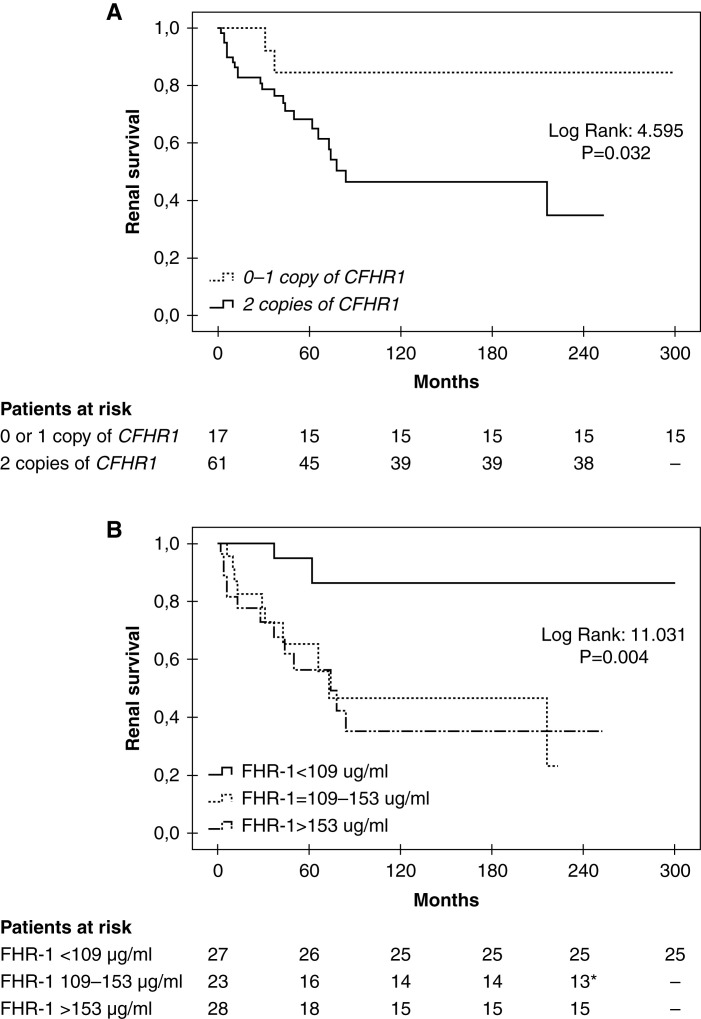
Figure 7.
Kaplan–Meier curves illustrate that lower number of CFHR1 copies or lower levels of plasma FHR-1 at diagnosis are associated with better renal survival. ESKD was considered as the event and a follow-up of 300 months is depicted. (A) The number of CFHR1 copies was established considering the presence of ΔCFHR3-CFHR1 and the deletion of CFHR1–CFHR4. (B) Plasma FHR-1 levels were determined in patient samples at diagnosis. Patients with a significant deterioration of renal function at diagnosis and who developed ESKD within the first month were excluded from the analysis. *A patient reached ESKD by month 216 and the maximum follow-up time for this group of patients was 223 months.

