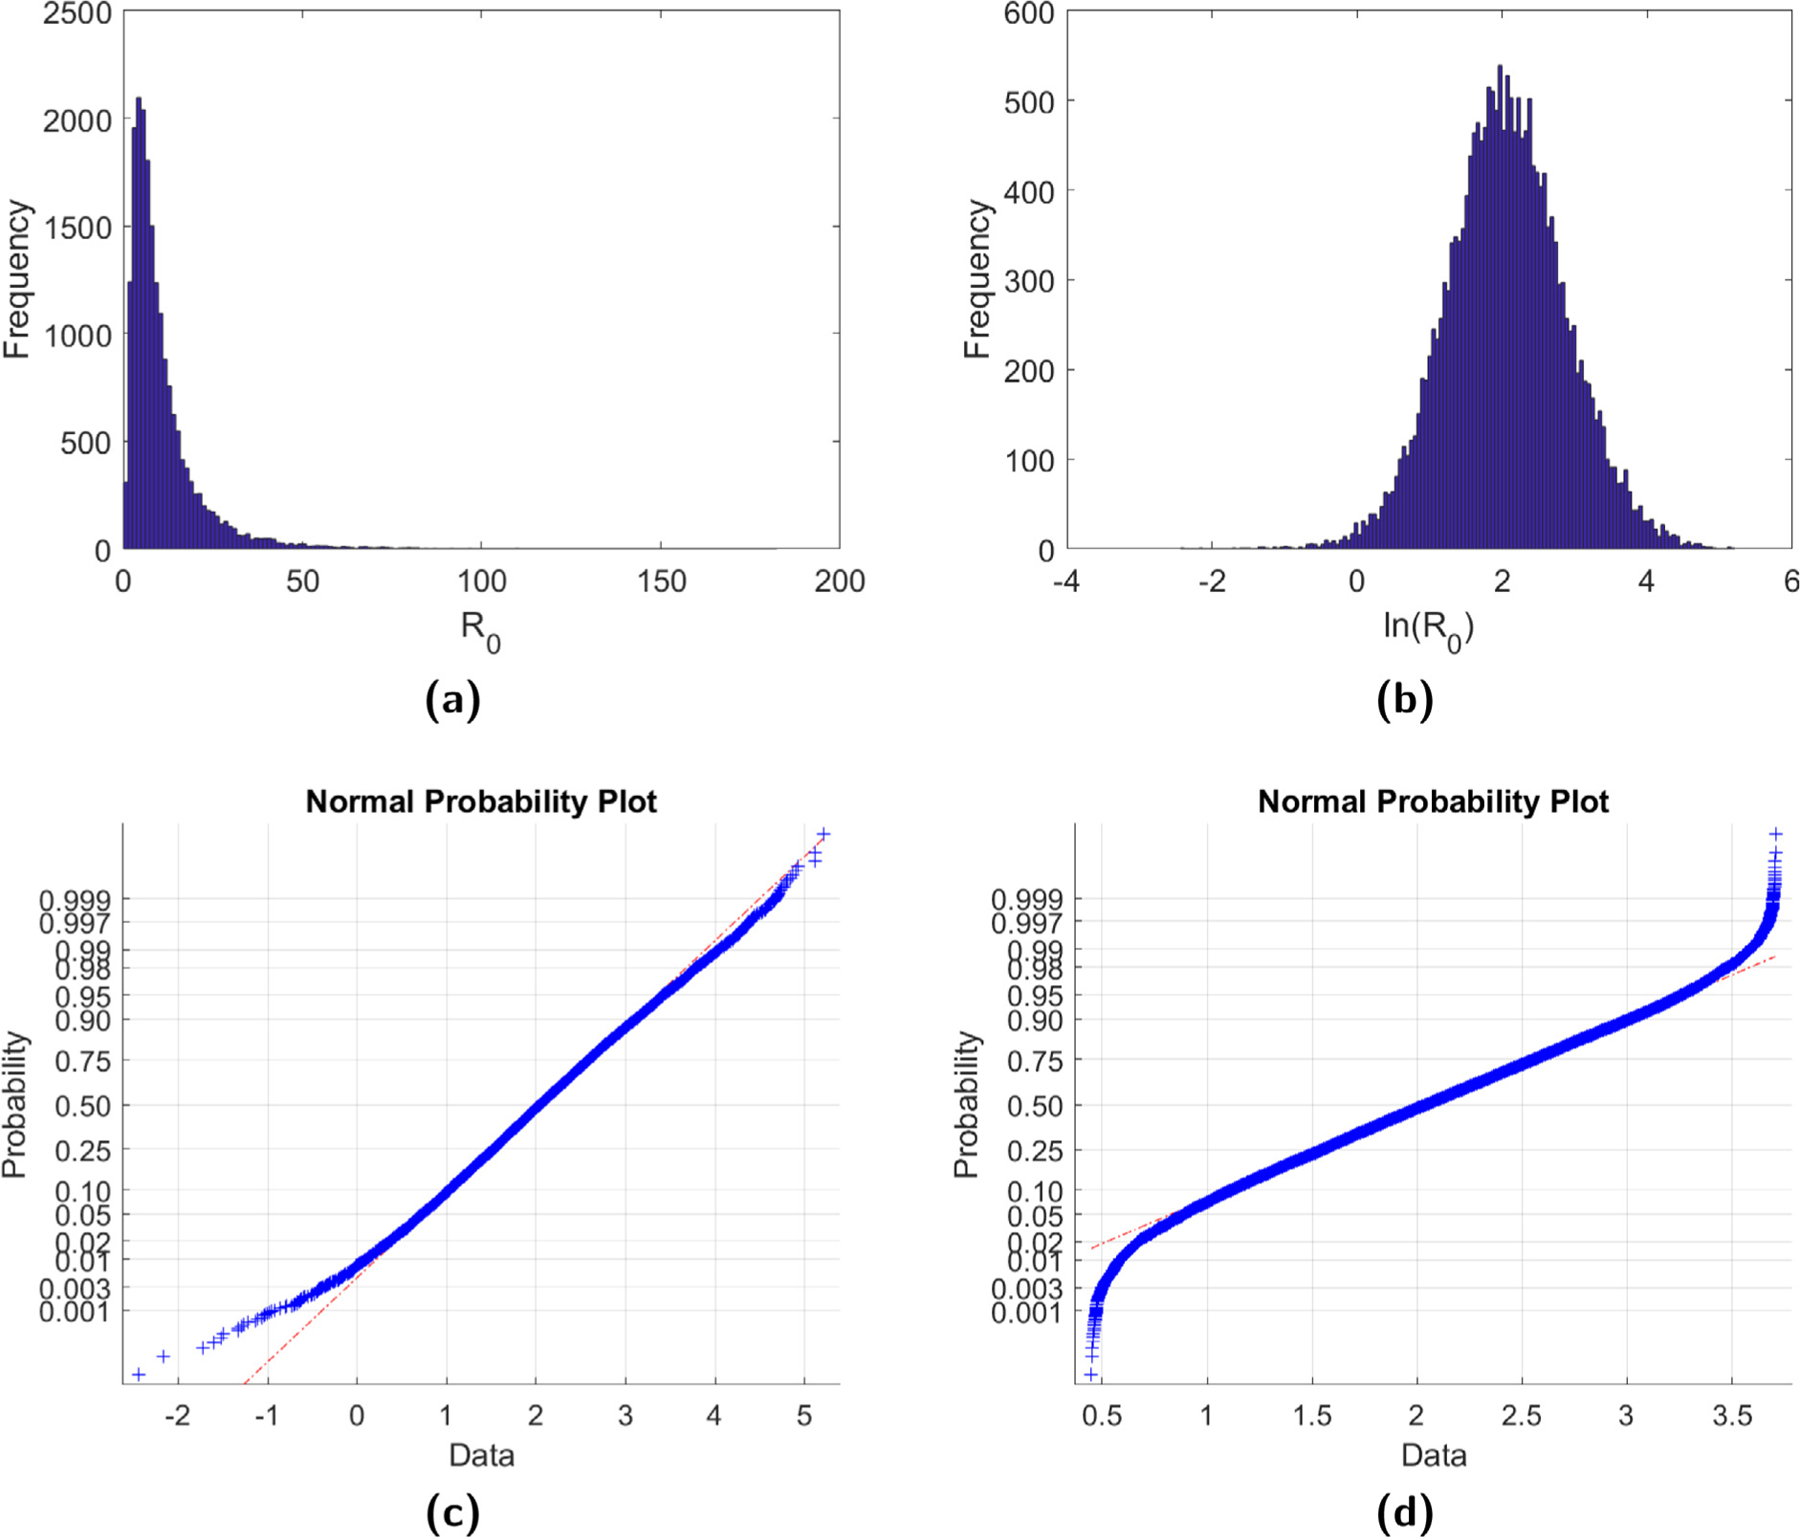
Fig. 2.

(a) A histogram of the R0 estimates for B. burgdorferi obtained from 20,000 sets of parameters chosen randomly from uniform distributions after removing all cases where . (b) The natural logarithmic transformation of the R0 estimates. Graphs (c) and (d) give the normal probability plot for ln(R0), with (d) obtained after removing the 500 largest and 500 smallest R0 values.
