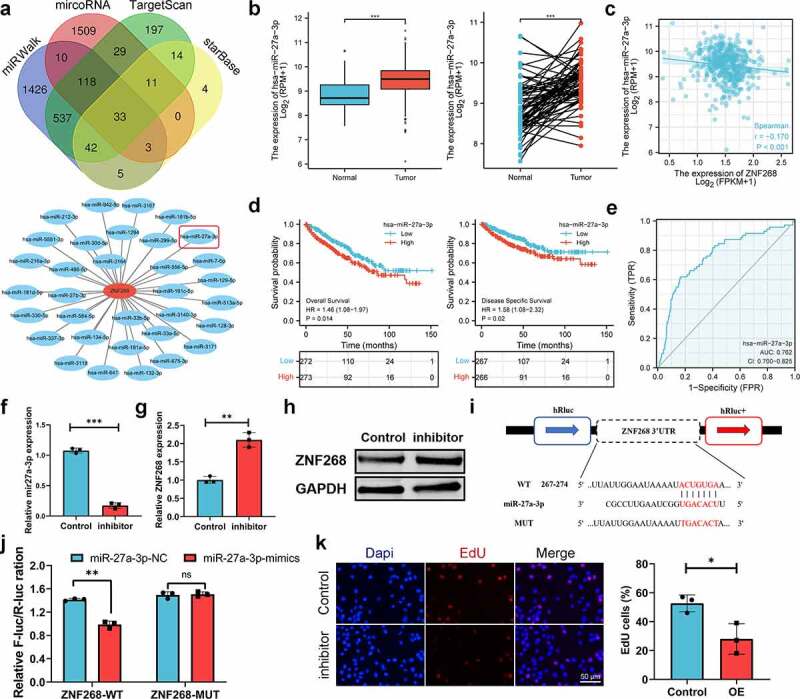
Figure 4.

MiR-27a-3p is selected as the upstream regulatory ncRNAs. (a) miRNA selection based on four predicting programs is exhibited by the Venn diagram, and the miRNA-ZNF268 regulatory network is established by Cytoscape software. (b) Expression of miR-27a-3p in ccRCC tissues and adjacent normal tissues with the matched analysis on the right. (c) ZNF268 expression is negatively related to miR-27a-3p expression in ccRCC. Kaplan-Meier curves of miR-27a-3p for overall and disease-specific survival (d) with ROC curve distinguishing ccRCC tissues in the right (e). (f) q-PCR analysis of miR-27a-3p expression after miR-27a-3p-inhibitor transfection. q-PCR (g) and Western blot (h) analysis of ZNF268 expression after transfection indicating the miR-27a-3p regulating function of ZNF268. (i) EdU results of ZNF268 overexpression in cell proliferation with the quantitative analysis in the reight. (Data represent means ± SD, **p < 0.01 and ***p < 0.001).
