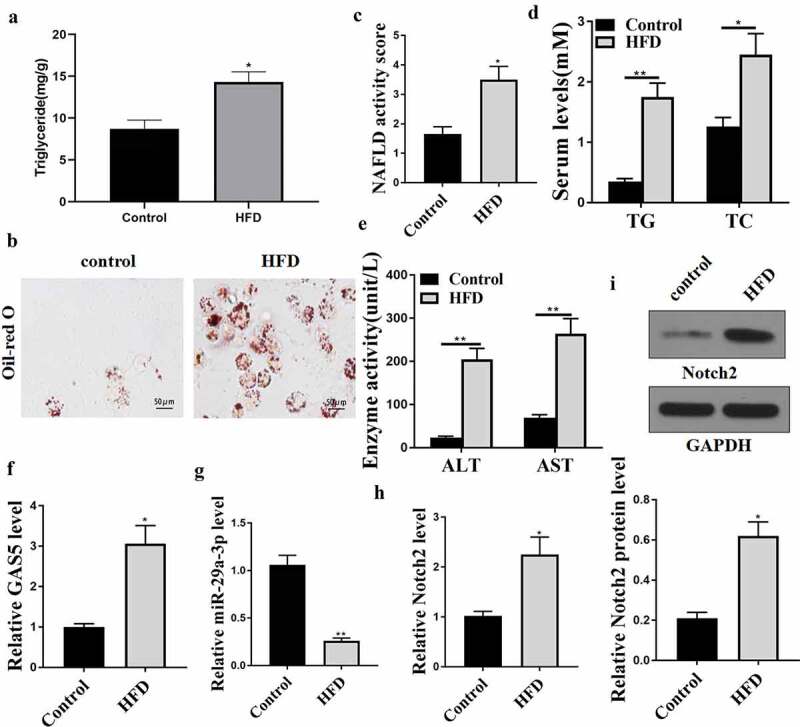
Figure 1.

GAS5, miR-29a-3p, and NOTCH2 expression levels are changed in the NAFLD mouse model. (a-h) NAFLD mouse model was established (n = 5). (a) Hepatic TG levels were assessed by ELISA. (b) Oil Red O staining of liver tissues. (c) NAFLD activity score. (d) Serum TC and TG levels were analyzed by ELISA. (e) Serum AST and ALT levels were tested by ELISA. (f) GAS5 expression was determined by qPCR. (g) MiR-29a-3p expression was examined by qPCR. (h) NOTCH2 expression was measured by qPCR. (i) NOTCH2 expression was analyzed by Western blot. Data are presented as mean ± SD. * P < 0.05, ** P < 0.01.
