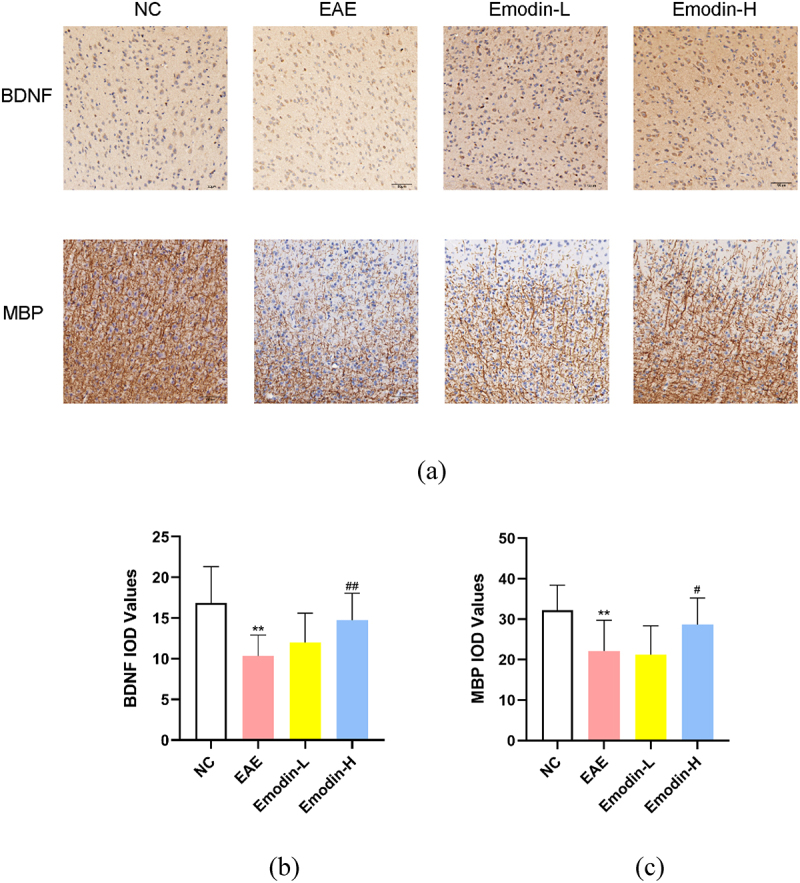
Figure 3.

The IHC staining of MBP and BDNF in the brains of mice on 21 dpi of EAE (a). The pictures were taken at ×200 magnification. The inflammatory scores of brains (b) and spinal cords (c) among NC, EAE, emodin-L. and emodin-H groups on 21 dpi. Data expressed as means ± S.D(n = 3). Comparisons among four groups were analyzed by one-way ANOVA in B and C. #P < 0.05 versus EAE group, ##P < 0.01 versus EAE group.
