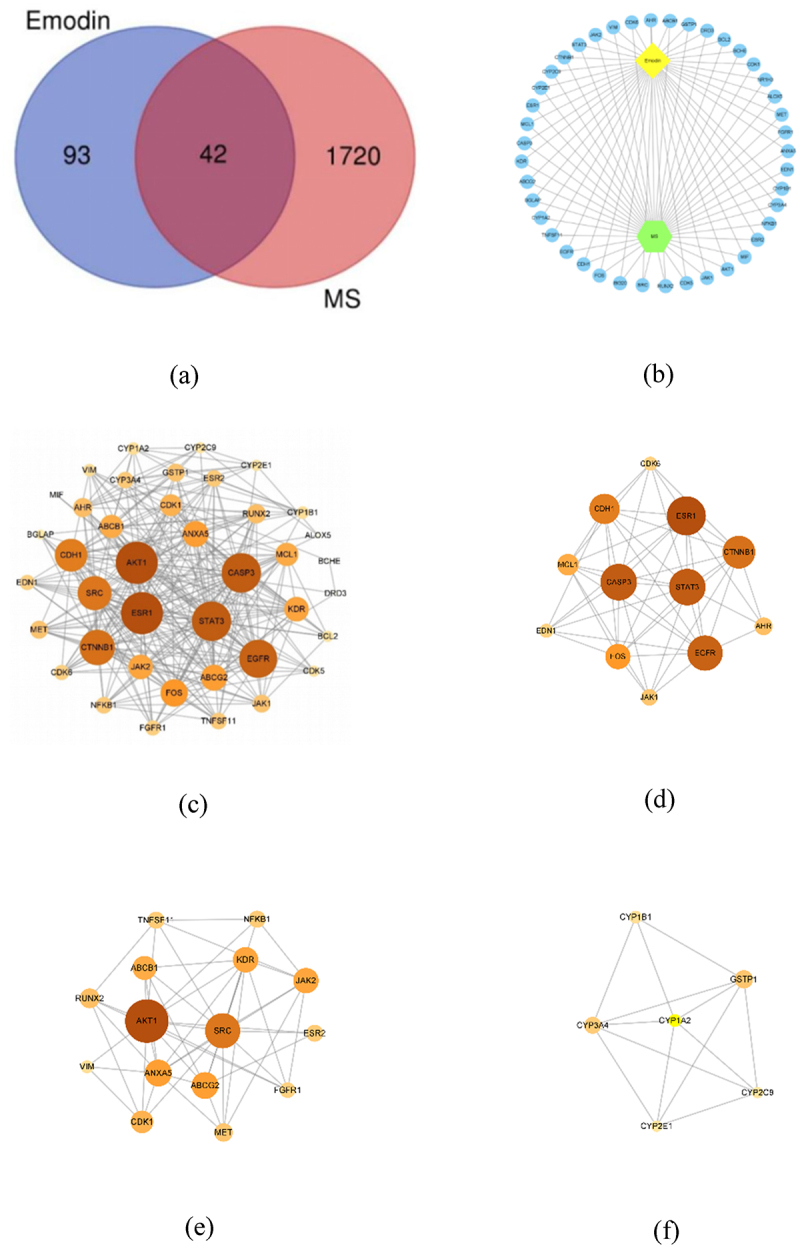
Figure 5.

The network diagram and the PPI network construction. Venn diagram of common targets showing emodin-related and MS-related common targets (a). The network diagram of emodin-targets-disease network was constructed (b). The PPI network was visualized by cytoscape 3.8.2 software (c). The larger node area and the darker color marked the most important targets in the network. The MCODE interaction network for visualization in cytoscape 3.8.2 software which divided into module 1 (d), module 2 (e), and module 3 (f).
