
Figure 6.
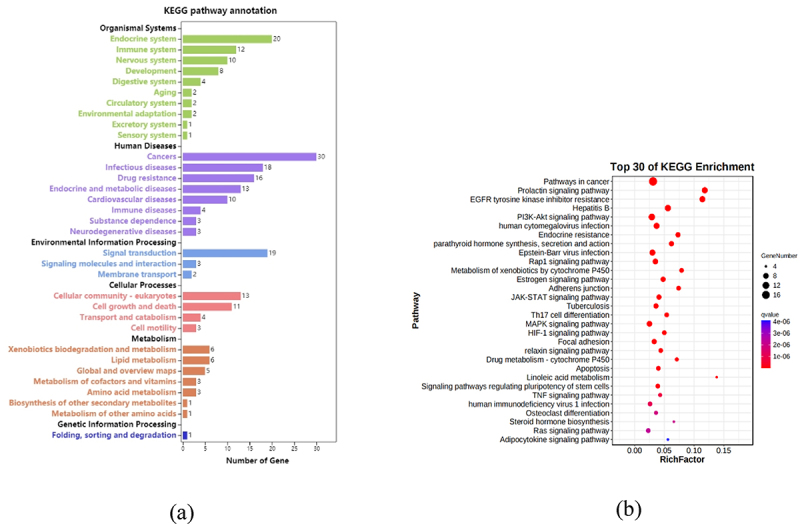
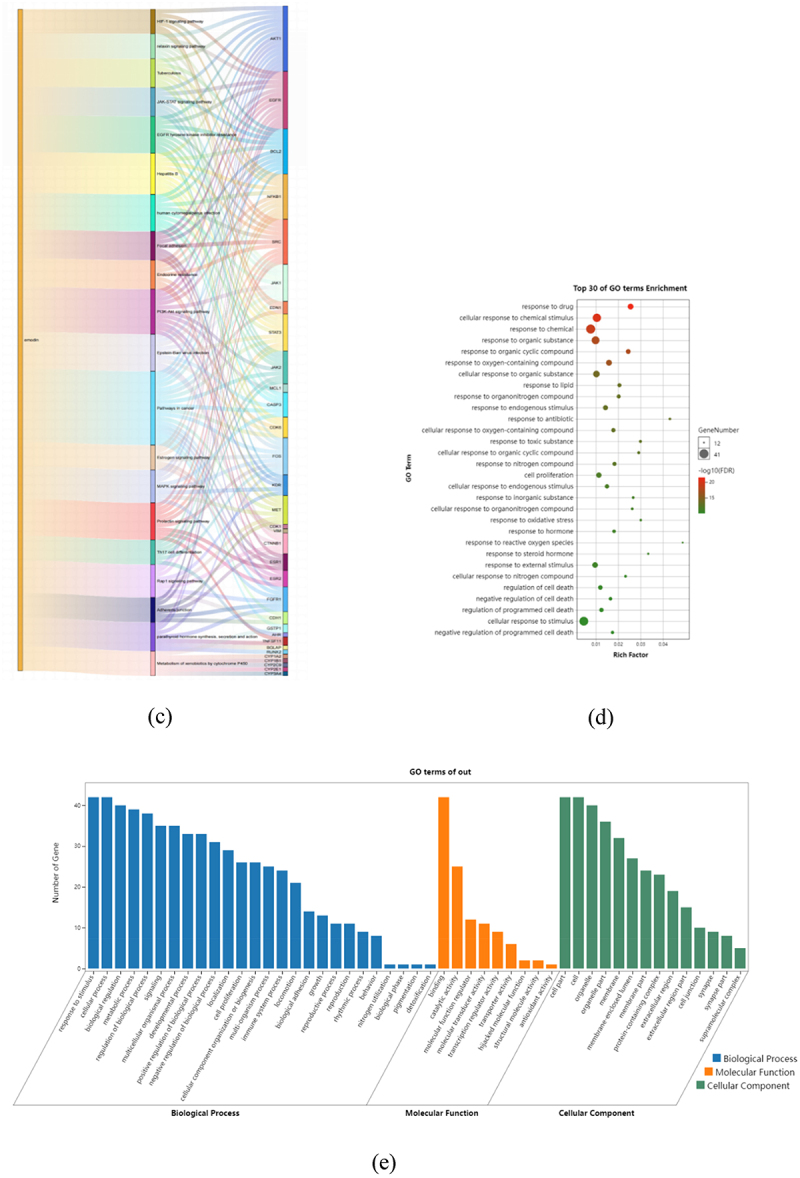
KEGG and GO enrichment analysis based on 42 core targets. Through KEGG pathway annotation (a), bubble chart (b), and Sankey diagram (c) of the pathways enriched for emodin and targets. GO enrichment analysis through bar chart (d) and bubble chart (e).
Figure 6.
(Continued).