Figure 9.

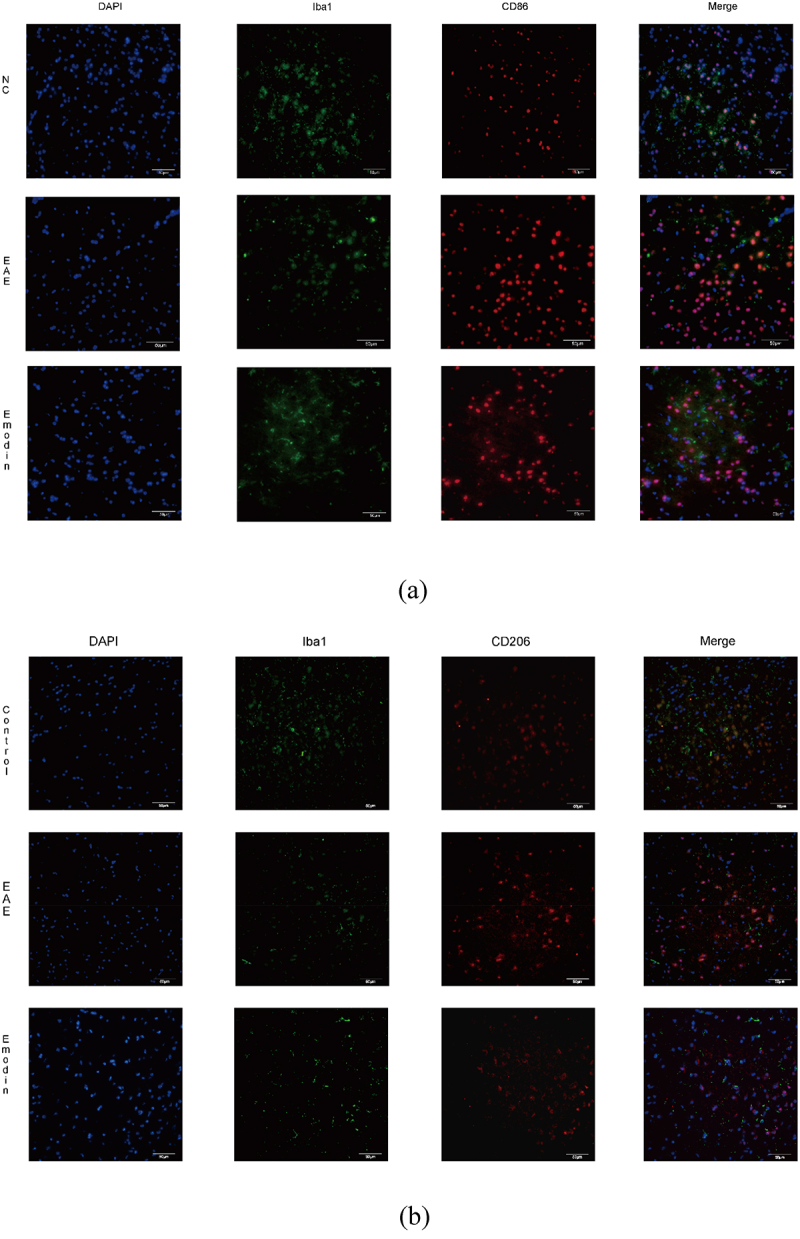
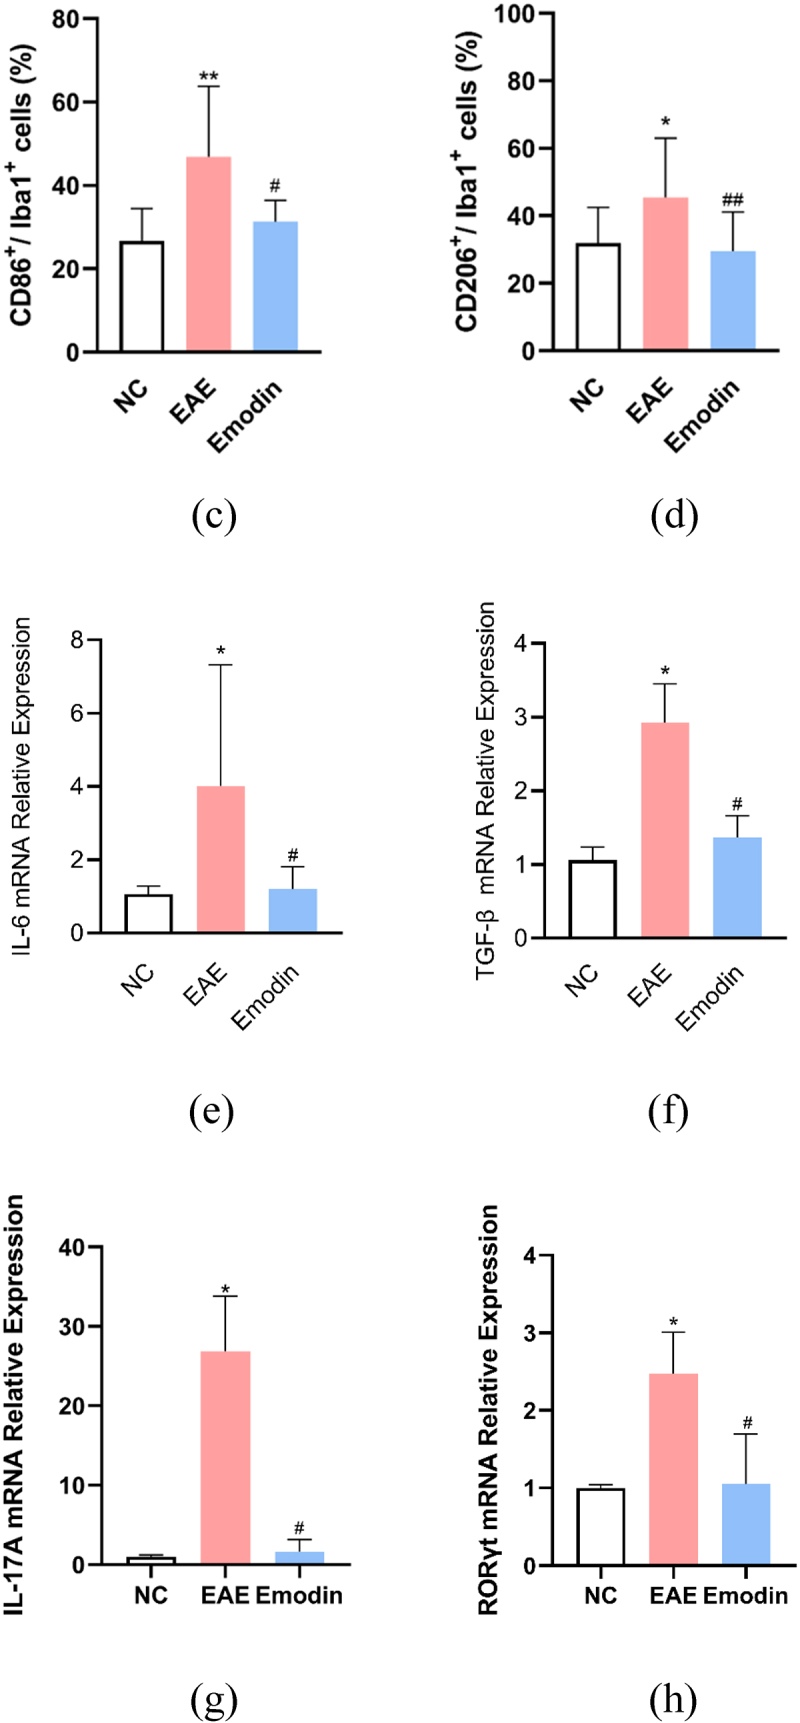
Emodin contributed to inhibition of the microglia activation. Double immunofluorescence staining of brain tissue with M1(CD86+/iba1+) (a) and M2(CD206+/iba1+) (b). The representative double immunofluorescence labeling image of CD86 (red)/Iba1 (green) in brain tissue, and the nuclei were stained with DAPI (blue). The representative double immunofluorescence labeling image of CD206 (red)/Iba1 (green) in brain tissue and the nuclei were stained with DAPI (blue). The quantity of the percentage of CD86+/Iba1+ cell (c) and CD206+/Iba1+ cell. (d) The effects of emodin on M1 microglia cell subsets mRNA relative expression. Mice were sacrificed on 21 dpi. The CNS tissues are collected. The IL-6 (e), TGF-β (f), IL-17A (g), and RORγt mRNA relative expression were analyzed by qRT-PCR, respectively. All data were expressed as mean ± S.D (n = 5). Comparisons among each group were analyzed by one-way ANOVA in C, D, F, and G. Comparisons among each group were analyzed by Kruskal-Wallis test using Bonferroni comparisons post hoc tests in E and H. *P < 0.05, **P < 0.01 versus NC group, #P < 0.05, ##P < 0.01 versus EAE group.
Figure 9.

(Continued).
