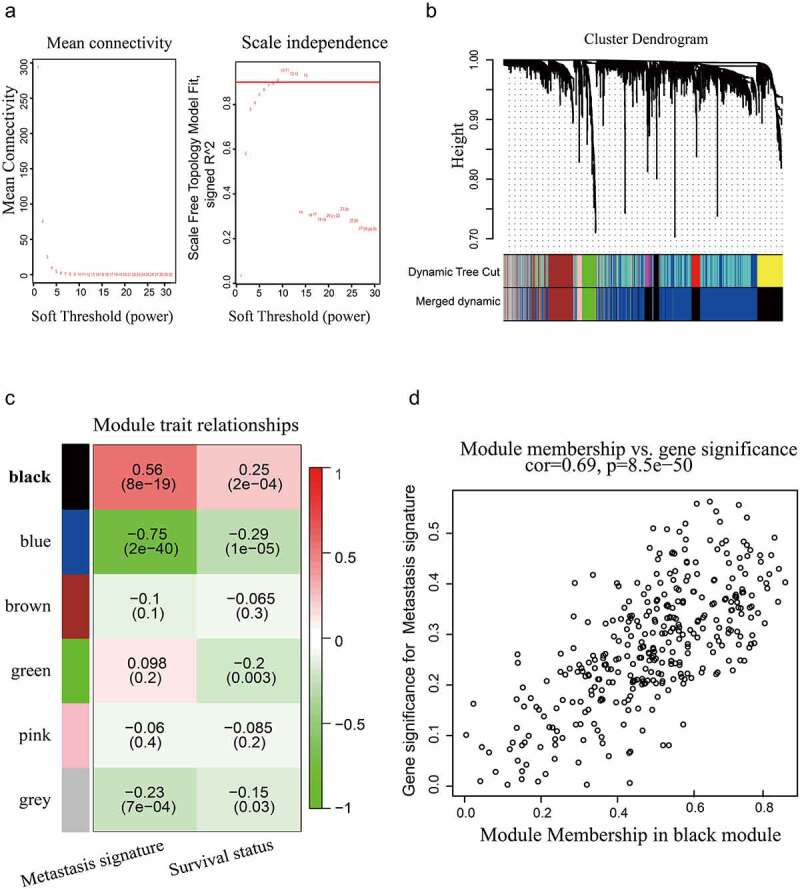
Figure 1.

WGCNA based on the GSE14520 dataset. (a) Optimal soft-thresholding power was selected according to the network topology analysis. (b) Five gene modules were identified in the clustering dendrogram of the prognostic genes. (c) Correlations between the gene modules and clinical traits. (d) The correlation between the black gene module and HCC metastasis is shown in the scatter plot.
