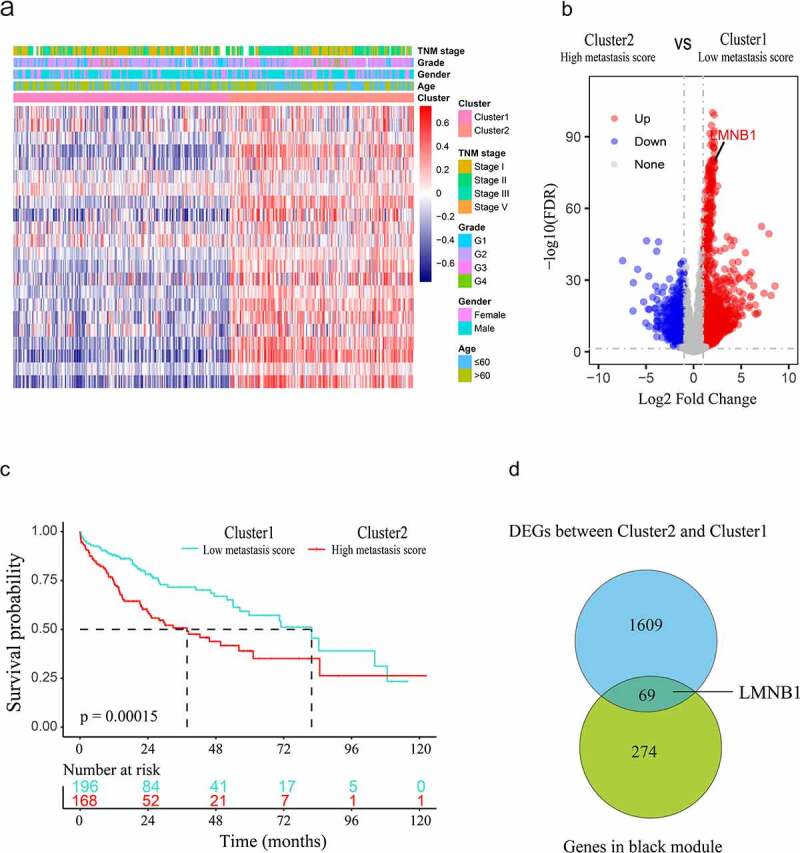
Figure 2.

Screening hub genes from the black module and DEGs. (a) Heatmap of the clusters defined by metastasis-associated gene sets based on consensus clustering. (b) DEGs between cluster 2 (high metastasis score) and cluster 1 (low metastasis score) are shown in the volcano plot. (c) Survival curve of HCC patients in cluster 1 and cluster 2. (d) The hub genes of HCC are shown in the Venn diagram.
