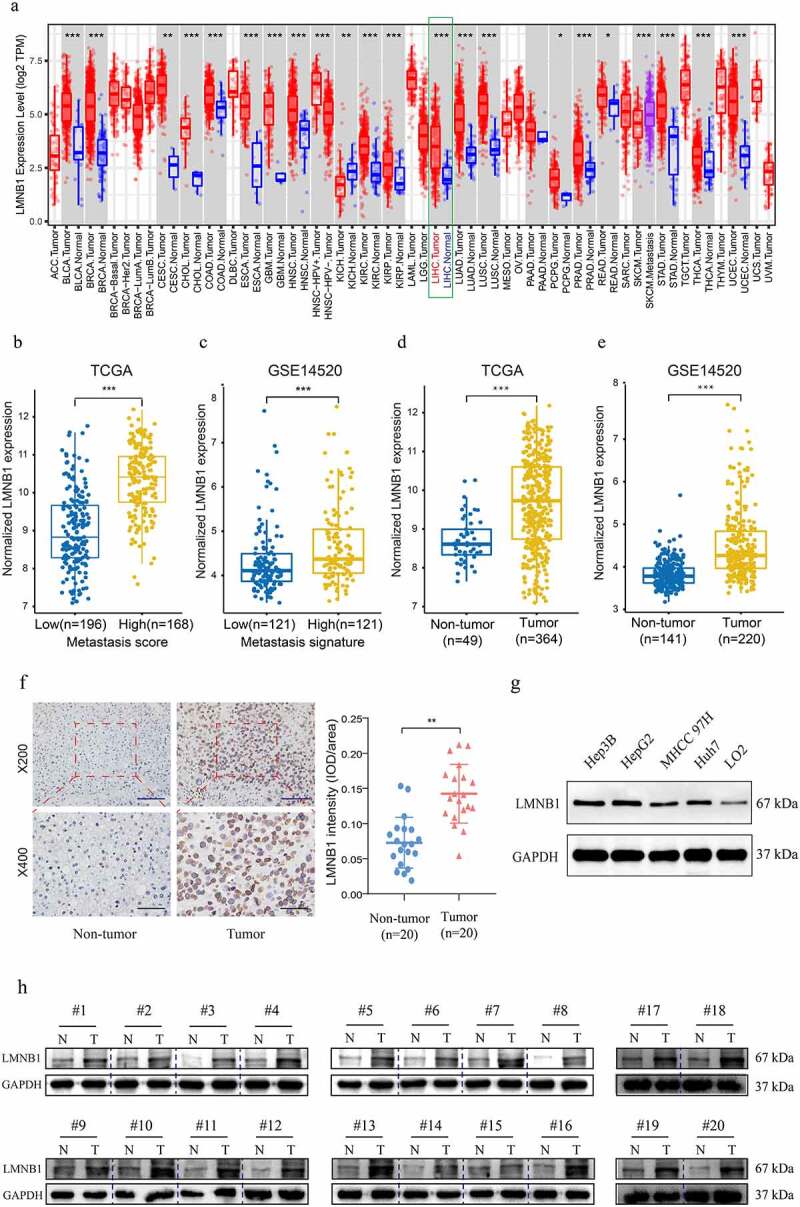
Figure 3.

Expression analysis of LMNB1 in HCC. (a) LMNB1 was abnormally expressed in different malignancies in the TIMER2 database. (b) LMNB1 was upregulated in patients with high metastasis scores. (c) LMNB1 was upregulated in patients with high metastasis signatures. (d, e) In the GSE14520 dataset (d) and TCGA-LIHC dataset (e), LMNB1 was overexpressed in HCC compared to peritumoral tissues. (f) Representative IHC images of HCC tissues and peritumoral tissues. IHC verified that LMNB1 was overexpressed in HCC. Scale bars (up) = 100 μm. Scale bars (low) = 50 μm. (g) Overexpression of LMNB1 was detected in HCC cell lines. (h) Western blot analysis of HCC tissues and peritumoral tissues. *P < 0.05, **P < 0.01, ***P < 0.001.
