
Figure 2.
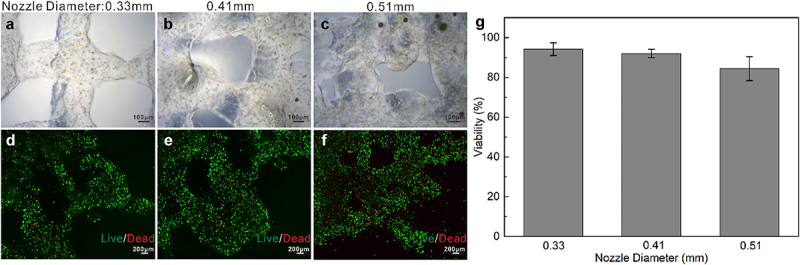
Optimization of printing conditions. A-C: Brightfield images of cellular constructs printed by the 0.33 mm, 0.41 mm, and 0.51 mm nozzle on day 1 after printing; D-F: Live/dead images of the encapsulated cells in the bio-ink on day 7 after printing; G: Cell viability analysis (Day 7).