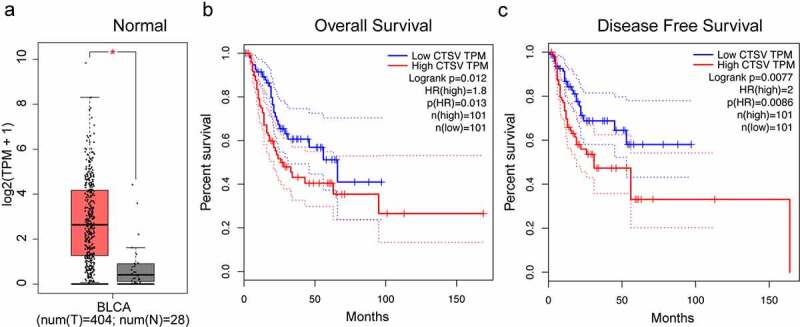
Figure 1.

Aberrant expression of CTSV in bladder cancer. A. The relative mRNA expression of CTSV in the bladder cancer tissues (n = 404) and normal tissues (n = 26). B. A Kaplan-Meier survival curve showing a significant association between the high levels of CTSV and poor overall survival of bladder cancer patients (p = 0.013). Low CTSV (n = 101) and high CTSV (n = 101). C. A Kaplan-Meier survival curve showing a significant association between the high levels of CTSV and poor survival in disease-free bladder cancer patients (p = 0.0086). Low CTSV (n = 101) and high CTSV (n = 101). Statistical significance was determined by Student’s t-test. *, p < 0.01.
