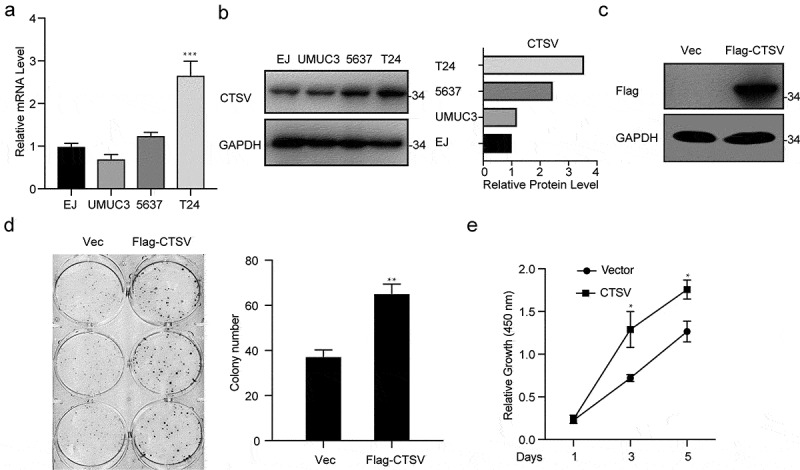
Figure 2.

Overexpression of CTSV facilitates bladder cancer cell viability. A and B. The qPCR and western blotting of the relative CTSV mRNA expression and protein levels, respectively in different bladder cancer cell lines, including EJ, UMUC3, 5637, and T24. UMUC3 was used to construct the CTSV overexpression cell line. C. The CTSV expression in UMUC3 cell lines tested by immunoblotting using an anti-Flag antibody. D. Colony formation assay performed both in wild-type cells and CTSV overexpression stable cell line with quantification of the colony numbers. E. Cell growth curve assay performed in wild-type cells and CTSV overexpression stable cell line. The relative cell number was measured at 450 nm using the CCK8 method on the indicated days. Error bars and mean ± SD obtained from three replicates. Statistical significance was determined by Student’s t-test or one-way ANOVA, *, p < 0.05, **, p < 0.01, ***, p < 0.001.
