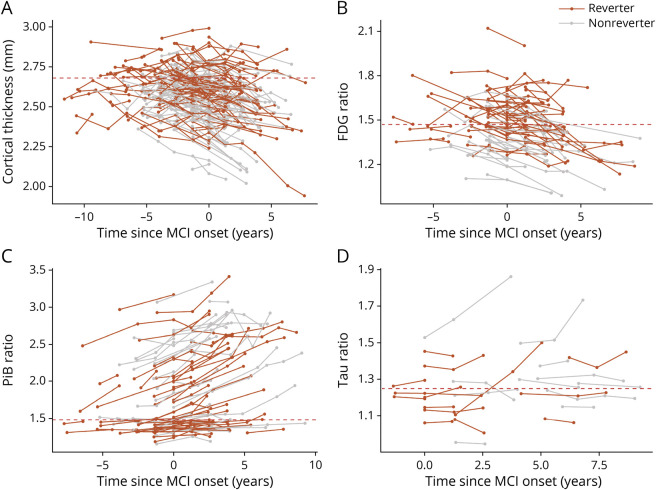
Figure 4. MRI and PET Imaging Outcomes of Reverters and Nonreverters in the Mayo Clinic Study of Aging.
(A) Cortical thinning rate detected by MRI in reverters and nonreverters. The cutoff point for neurodegeneration is indicated by the dashed red line (2.68 mm). (B) Changes in brain glucose metabolism detected by FDG-PET in reverters and nonreverters. The cutoff point for abnormal glucose metabolism is indicated by the dashed red line (1.47). (C) Brain amyloid accumulation measured by Pittsburgh compound B (PiB)–PET in reverters and nonreverters. The cutoff point for amyloid positivity is indicated by the dashed red line (1.48). (D) Brain tau pathology detected by 18F-flortaucipir-PET in reverters and nonreverters. The cutoff point for tau positivity is indicated by the dashed red line (1.25). MCI = mild cognitive impairment.

