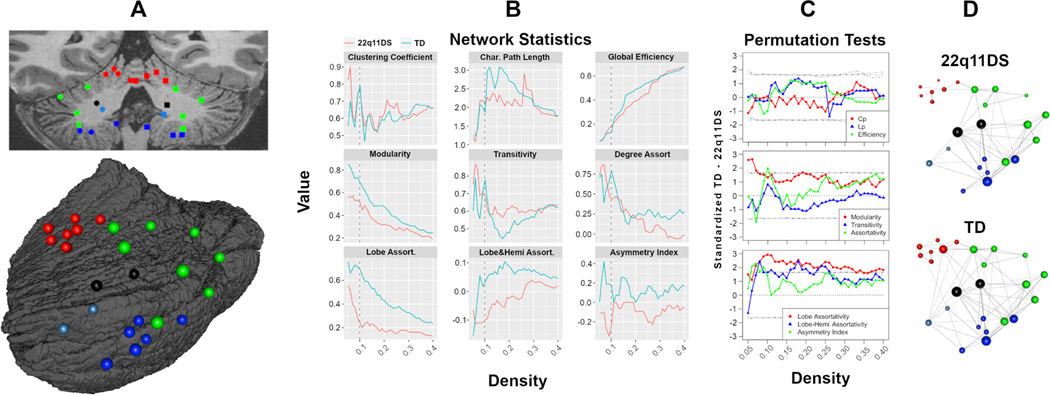
Figure 4:
Results from graph theoretical models. At left (Panel A), the centroid for each ROI is projected on a coronal slice, as well as a left posterior lateral oblique surface projection; each node is color coded based on lobe. At center (B), global network statistics for a range of graph densities are plotted for each group separately. Panel C displays results of permutation tests, with standardized TD - 22q11DS difference scores at each graph density; these plots are overlaid on null distributions, with gray lines indicating 5th, 50th, and 95th quantiles. Finally, panel D provides representative structural covariance graphs (density = 0.1) for each group.

