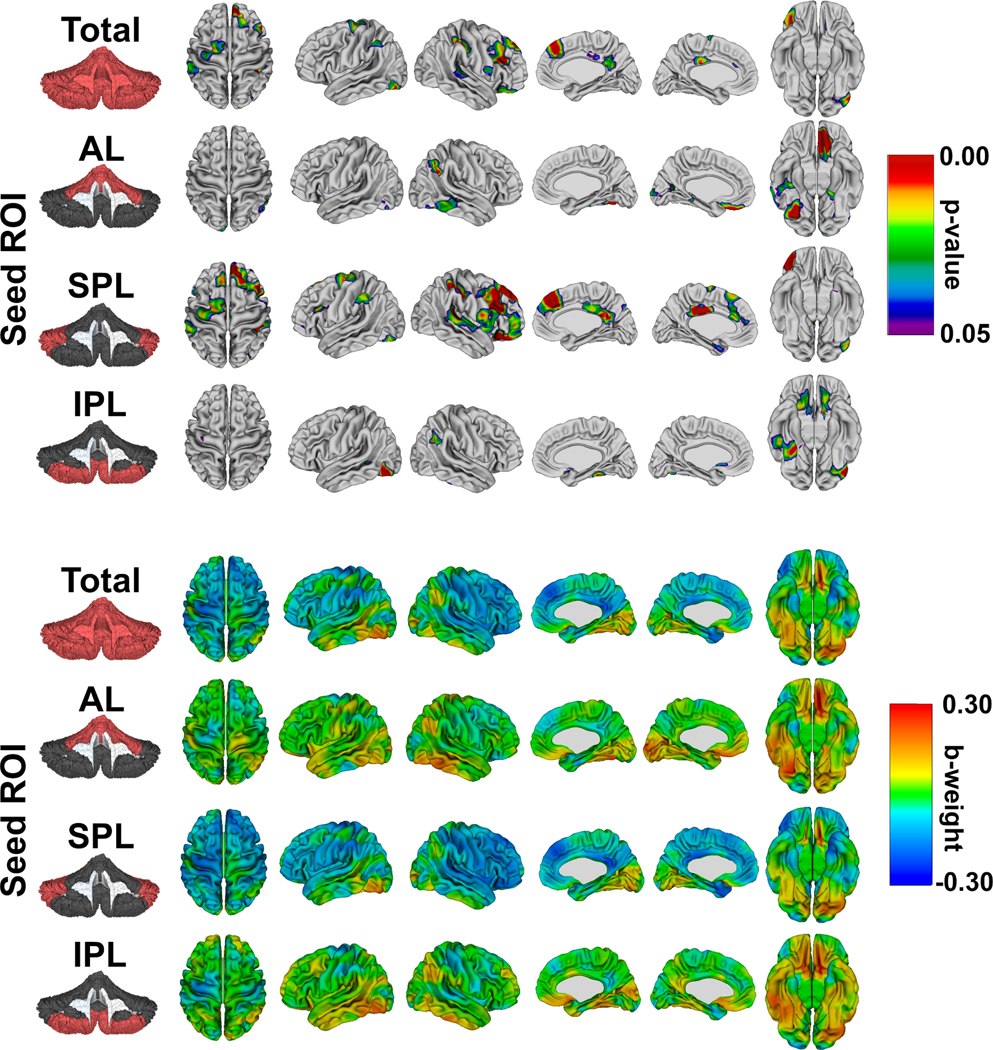
Figure 5:

Group differences in cerebro-cerebellar associations for cerebellar lobes. FDR-corrected probability maps (top) show statistically significant total and lobar cerebellum x group interactions on vertex-level measures of cortical thickness. The color maps (bottom) display the standardized b-weights for the ROI x diagnosis interaction (TD dummy coded 1, 22q11DS 0). Red indicates thicker cortex in the TD group with increasing volumes (relative to 22q11DS), with areas in blue having relatively thicker cortex in 22q11DS.
