
Fig. (5).
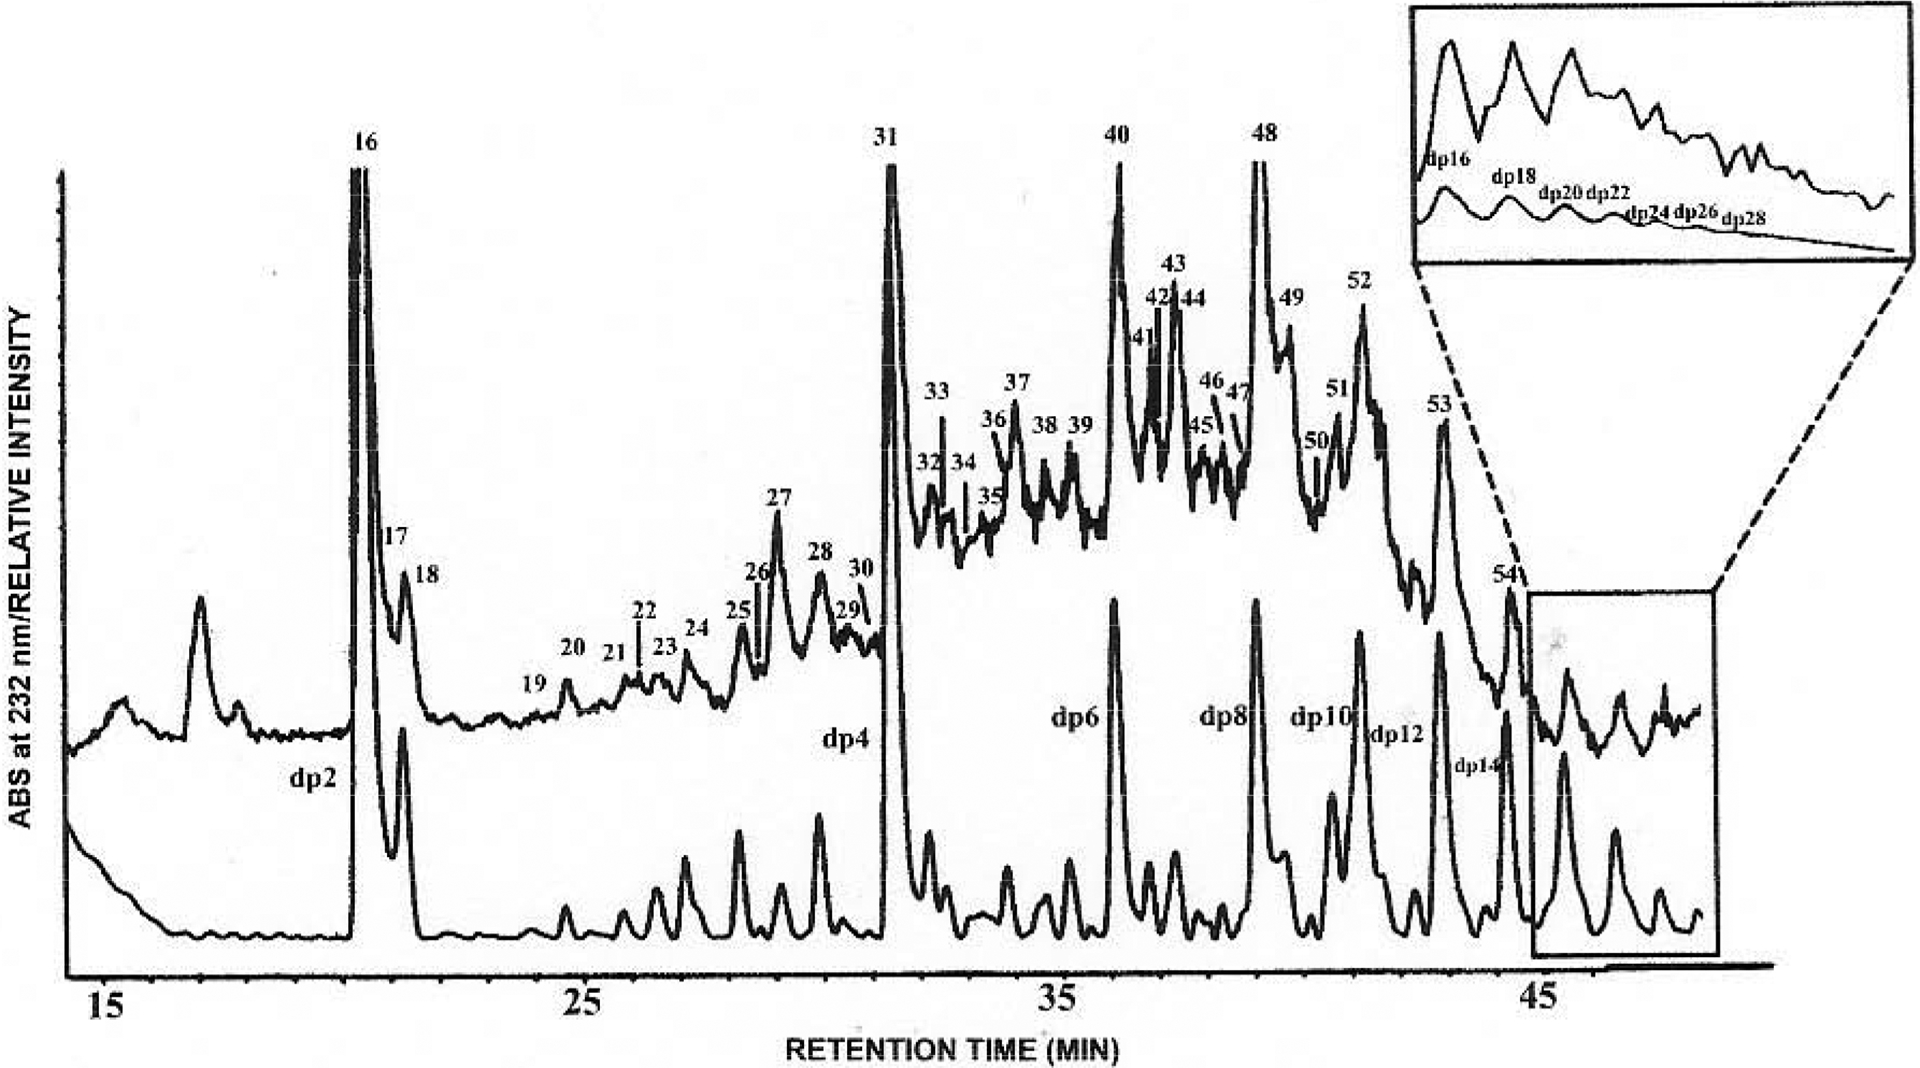
LC/MS analysis of heparin-derived oligosaccharides. The main figure shows the UV trace (lower) and MS-TIC trace (upper with numbered peaks) of RPIP-HPLC separation. Early time in the LC/MS analysis (inset) shows the TIC of mono- and disaccharides using the shallow elution gradient. (Adapted from ref. 63).