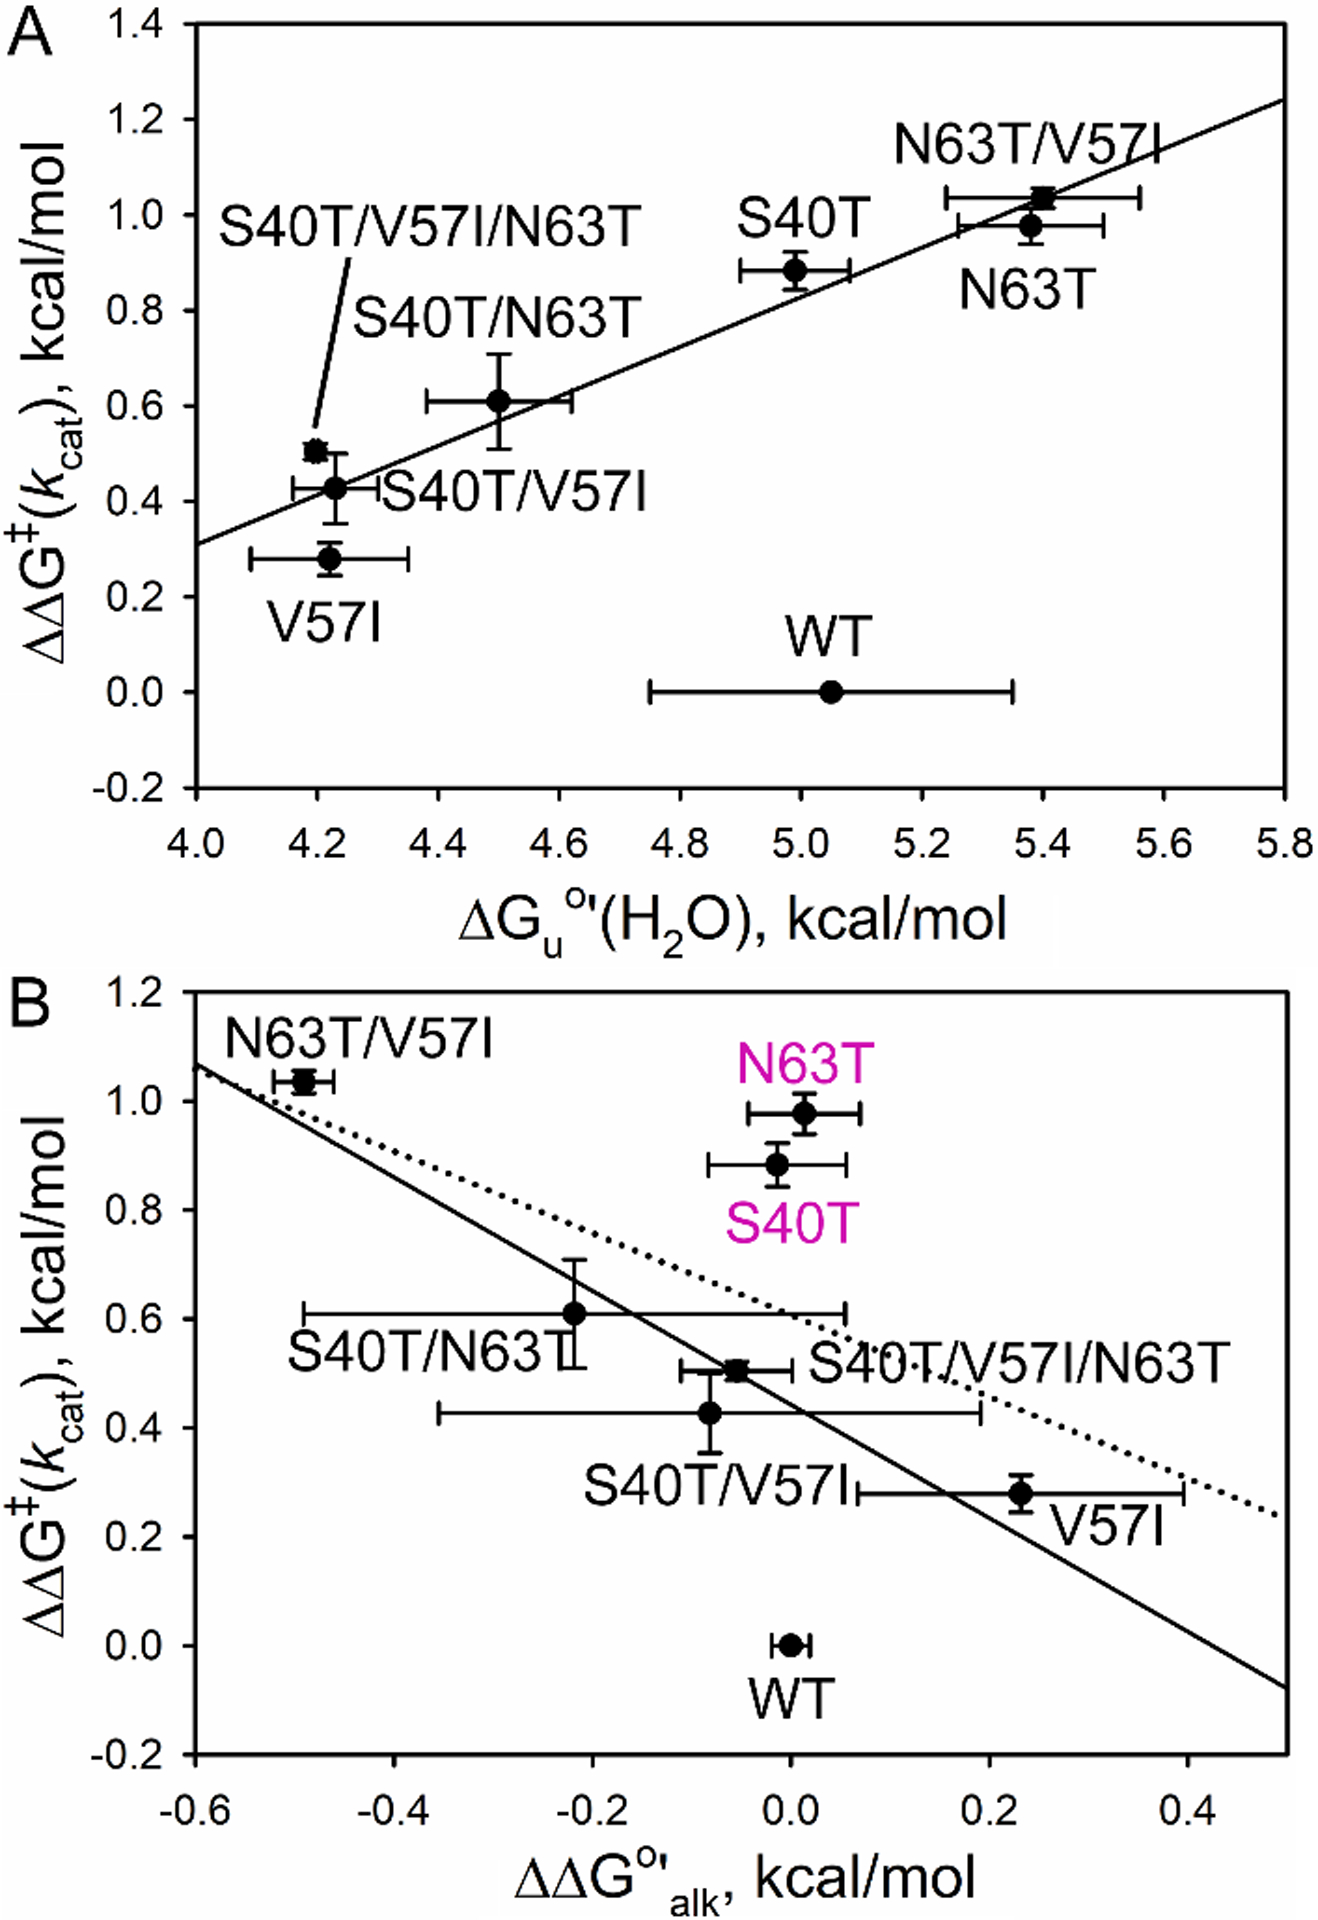
Fig. 10. (.

A) Plot of ΔΔG‡(kcat) at pH 8 versus ΔGuo′(H2O) for all variants. The solid line is the correlation without WT iso-1-Cytc (R = 0.96). (B) Plot of ΔΔG‡(kcat) at pH 8 versus ΔΔG°′alk. The dotted line is the correlation without WT iso-1-Cytc (R = 0.57). The solid correlation line (R = 0.96) also does not include the S40T and N63T variants. ΔΔG‡(kcat) = −RTln(kcat,mut/kcat,WT). The error bars are propagated from the errors in kcat. ΔΔG°′alk = 2.3RT(pKa,mut – pKa,WT). The error bars are propagated from the errors in the pKa for the alkaline transition.
