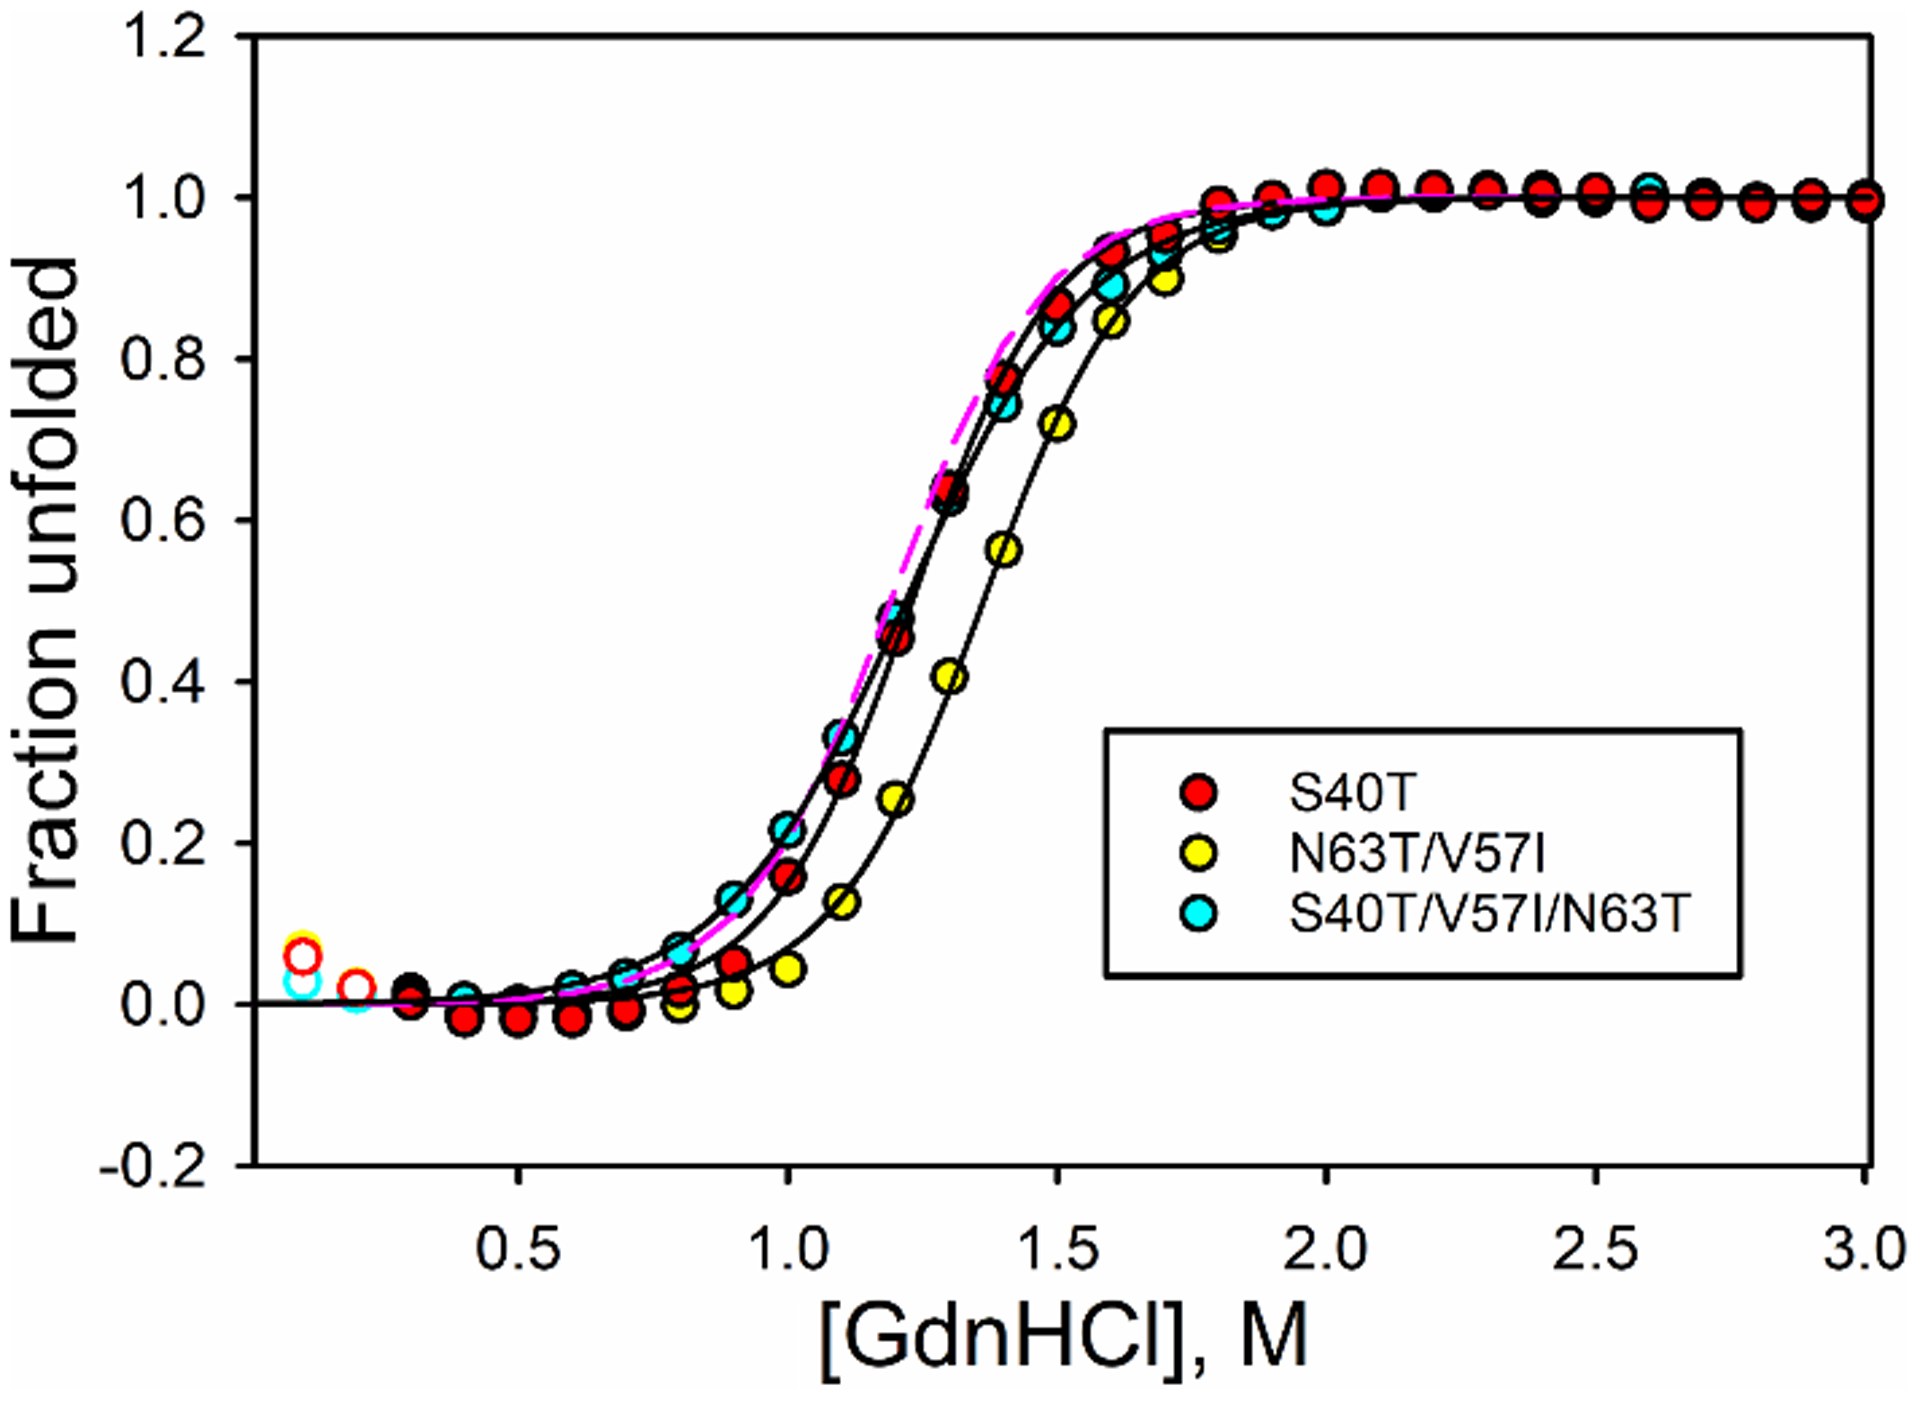
Fig. 2.

Plots of fraction of protein unfolded for selected iso-1-Cytc variants as a function of GdnHCl concentration. Fraction unfolded was calculated from fits of eq 1 to θ222corr vs GdnHCl concentration data. Open circles are data points that were not used in the fit. Solid curves are fits of a two-state model (eq 1) to the data. Data are shown for the S40T (red circles), N63T/V57I (yellow circles) and S40T/V57I/N63T (cyan circles) variants. The dashed magenta line is fraction unfolded for WT iso-1-Cytc using the parameters in Table 1.
