
Fig. 4.
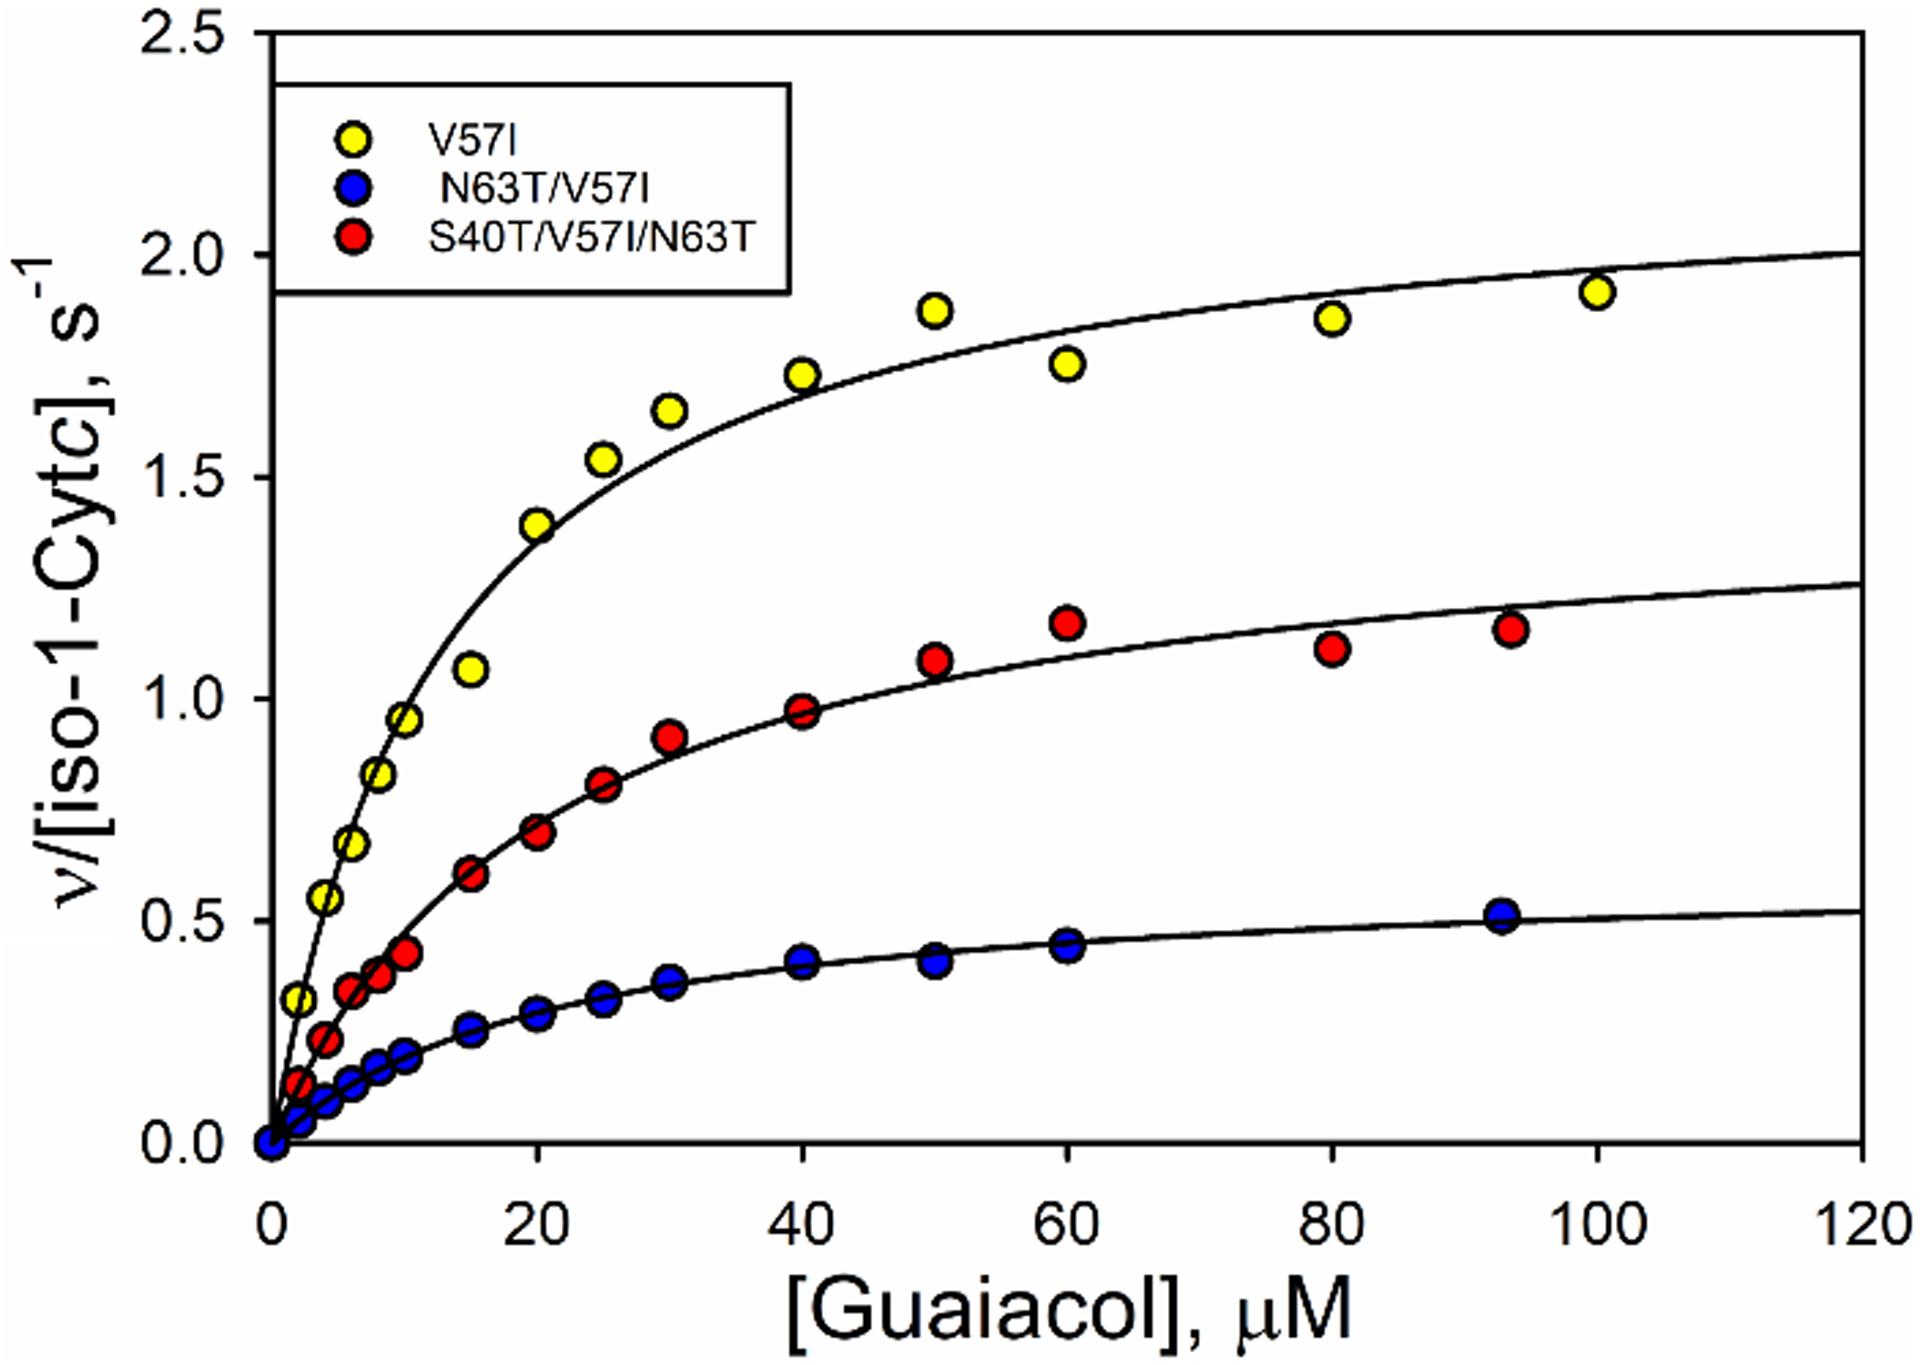
Michaelis-Menten plots at pH 8 for variants V57I (yellow), N63T/V57I (blue) and S40T/V57I/N63T (red). Black lines are fits of the Michaelis-Menten equation to the data.
Official websites use .gov
A
.gov website belongs to an official
government organization in the United States.
Secure .gov websites use HTTPS
A lock (
) or https:// means you've safely
connected to the .gov website. Share sensitive
information only on official, secure websites.
Michaelis-Menten plots at pH 8 for variants V57I (yellow), N63T/V57I (blue) and S40T/V57I/N63T (red). Black lines are fits of the Michaelis-Menten equation to the data.