Fig. 6.

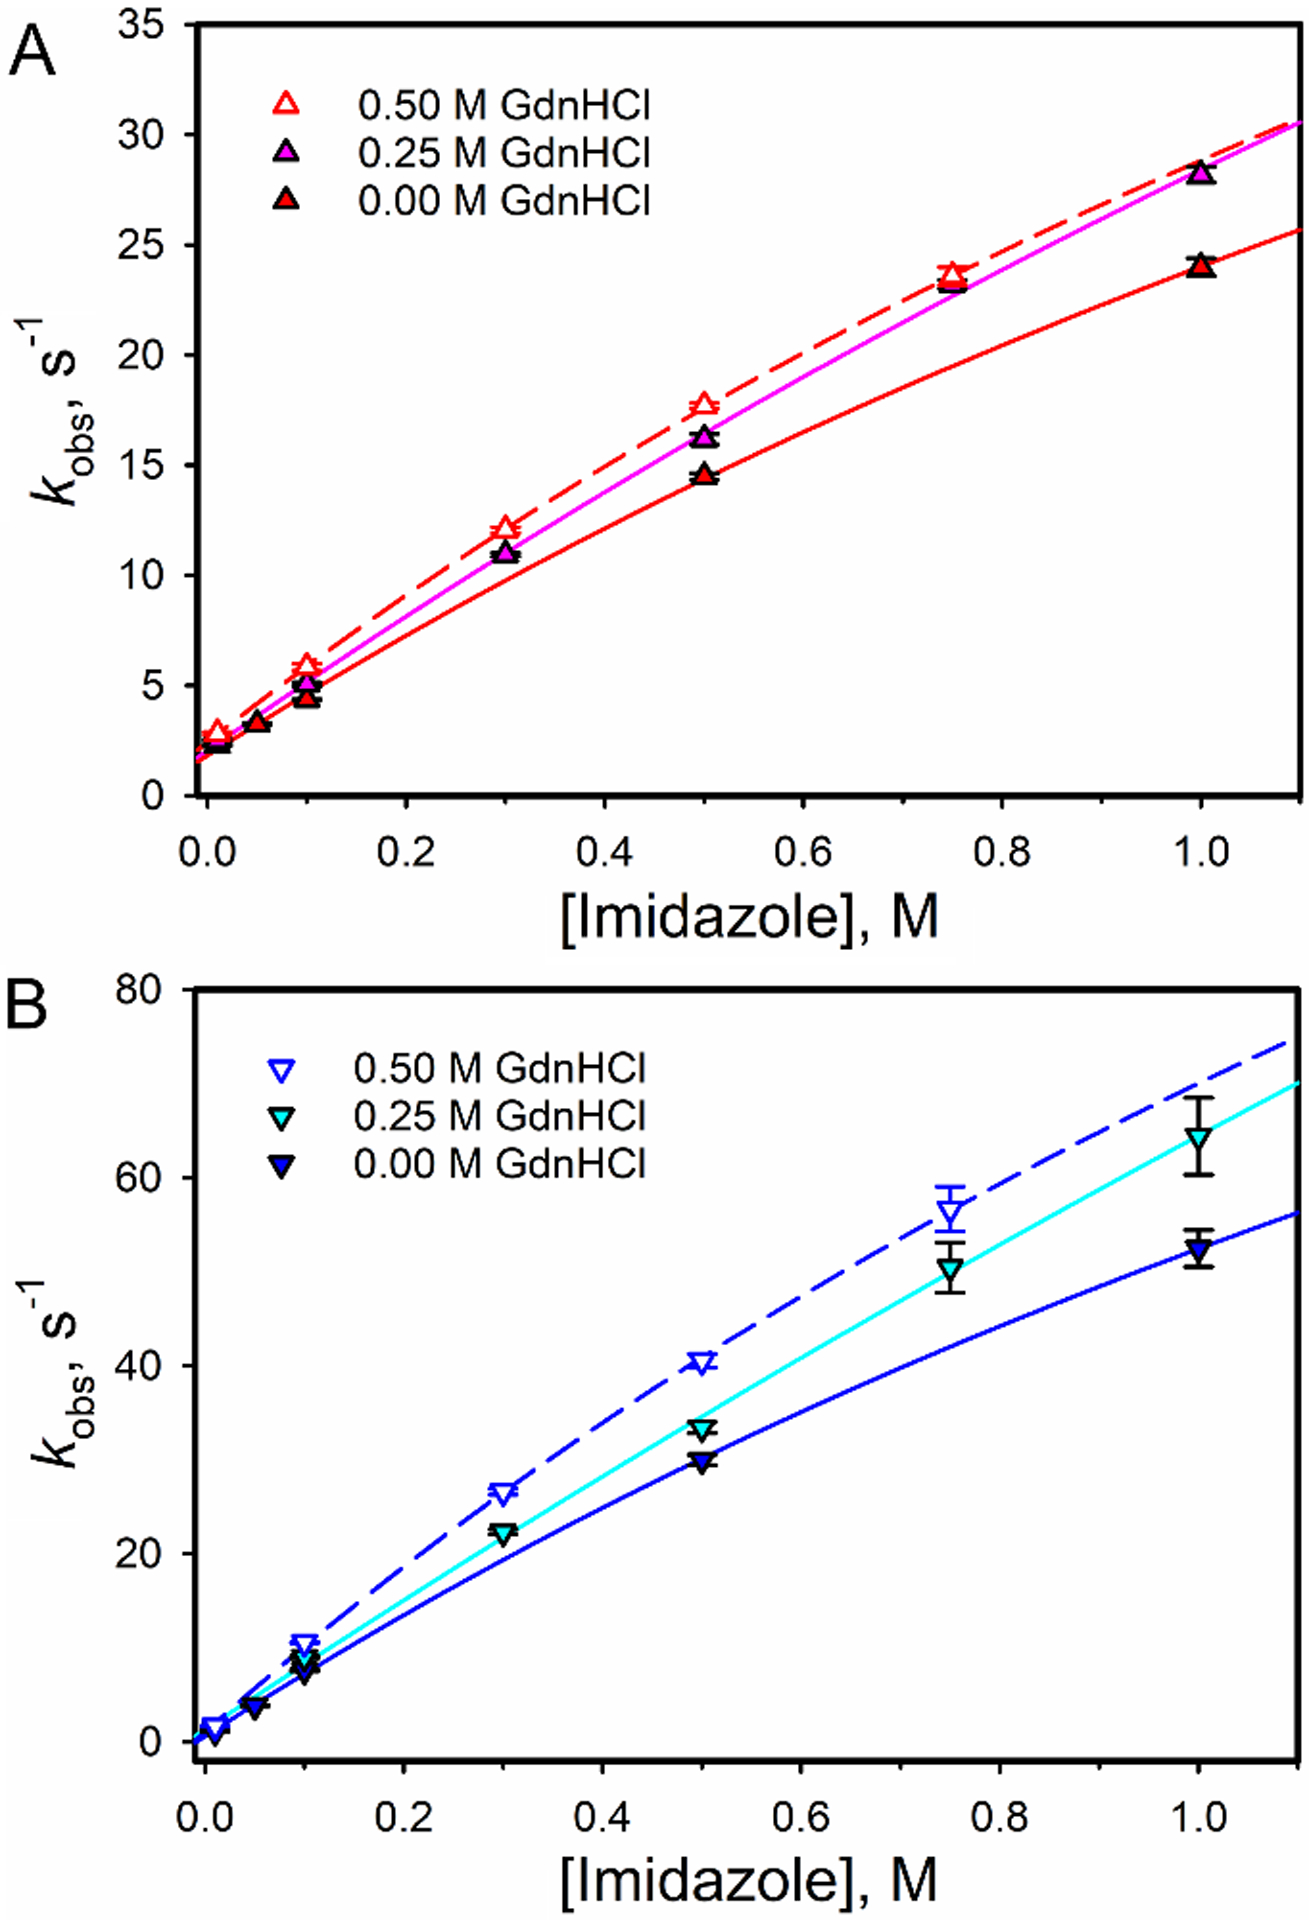
Plots of kobs versus Im concentration at 0, 0.25 and 0.50 M GdnHCl for (A) horse heart Cytc and (B) K72A/K73A/K79A iso-1-Cytc. All data were measured at a constant ionic strength of 1.25 M. Solid curves are fits of eq 2 to the data.

Plots of kobs versus Im concentration at 0, 0.25 and 0.50 M GdnHCl for (A) horse heart Cytc and (B) K72A/K73A/K79A iso-1-Cytc. All data were measured at a constant ionic strength of 1.25 M. Solid curves are fits of eq 2 to the data.