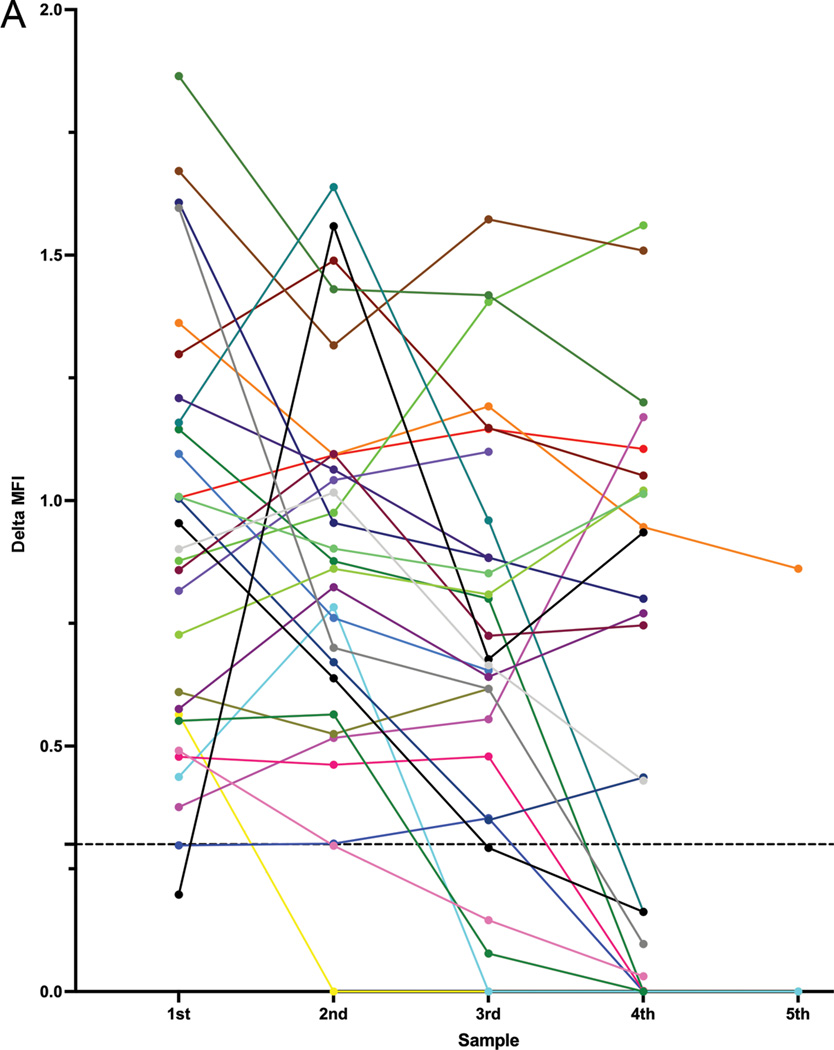
Figure 4. PD-1 expression in Sezary cells over time.
A. Log difference in PD-1 MFI between Sezary cell and internal normal CD4+ T cell populations in MF/SS patients. Each colored line represents 1 patient and up to 5 representative samples are depicted in chronological order. The 5 patients in which PD-1 remained uninformative over time are not depicted. Dotted horizontal line indicates the 1/3 log level.

