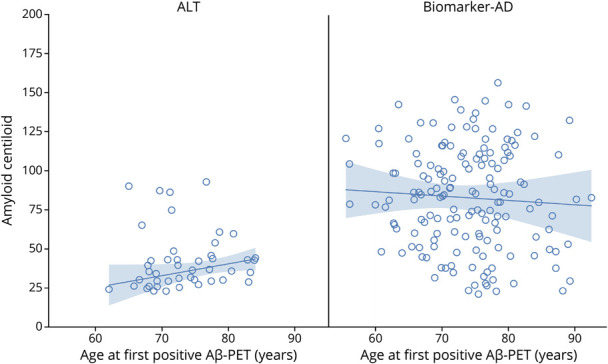
Figure 4. Centiloid at First Abnormal Amyloid PET Scan Vs Age.

The trend line and 95% CI represent the estimated median Centiloid by age based on quantile regression. This model is used because the Centiloid values in the amyloid+ with low tau (ALT) group are positively skewed. Aβ = β-amyloid; AD = Alzheimer disease.
