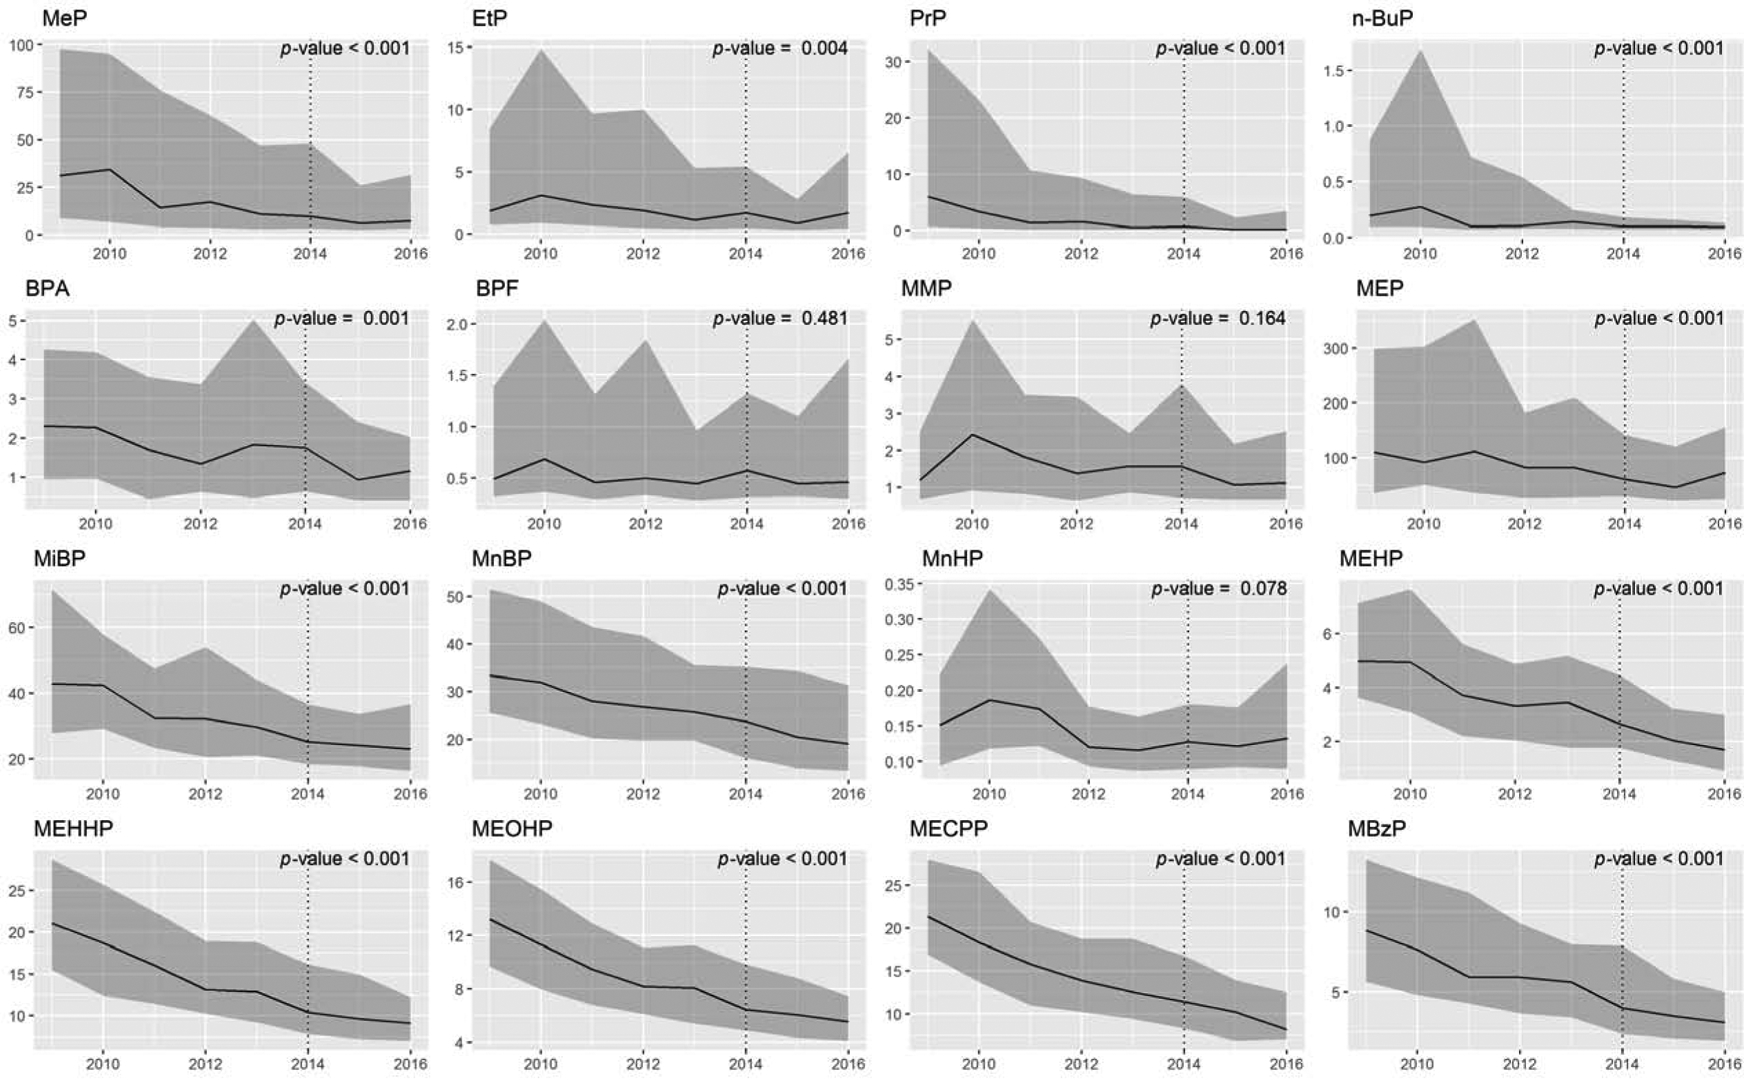
Figure 1.

Yearly excretions of urinary endocrine disrupting chemicals.
Yearly phenol and phthalate excretions (μg/24 hour) are expressed as median [interquartile range]. The dotted line depicts the end of baseline sample collection (2009 – 2014), and the beginning of follow-up sample collection (2014 – 2016). The p-values show whether the change in EDC excretion changes significantly over time. Full names of abbreviations are shown in Table 1.
