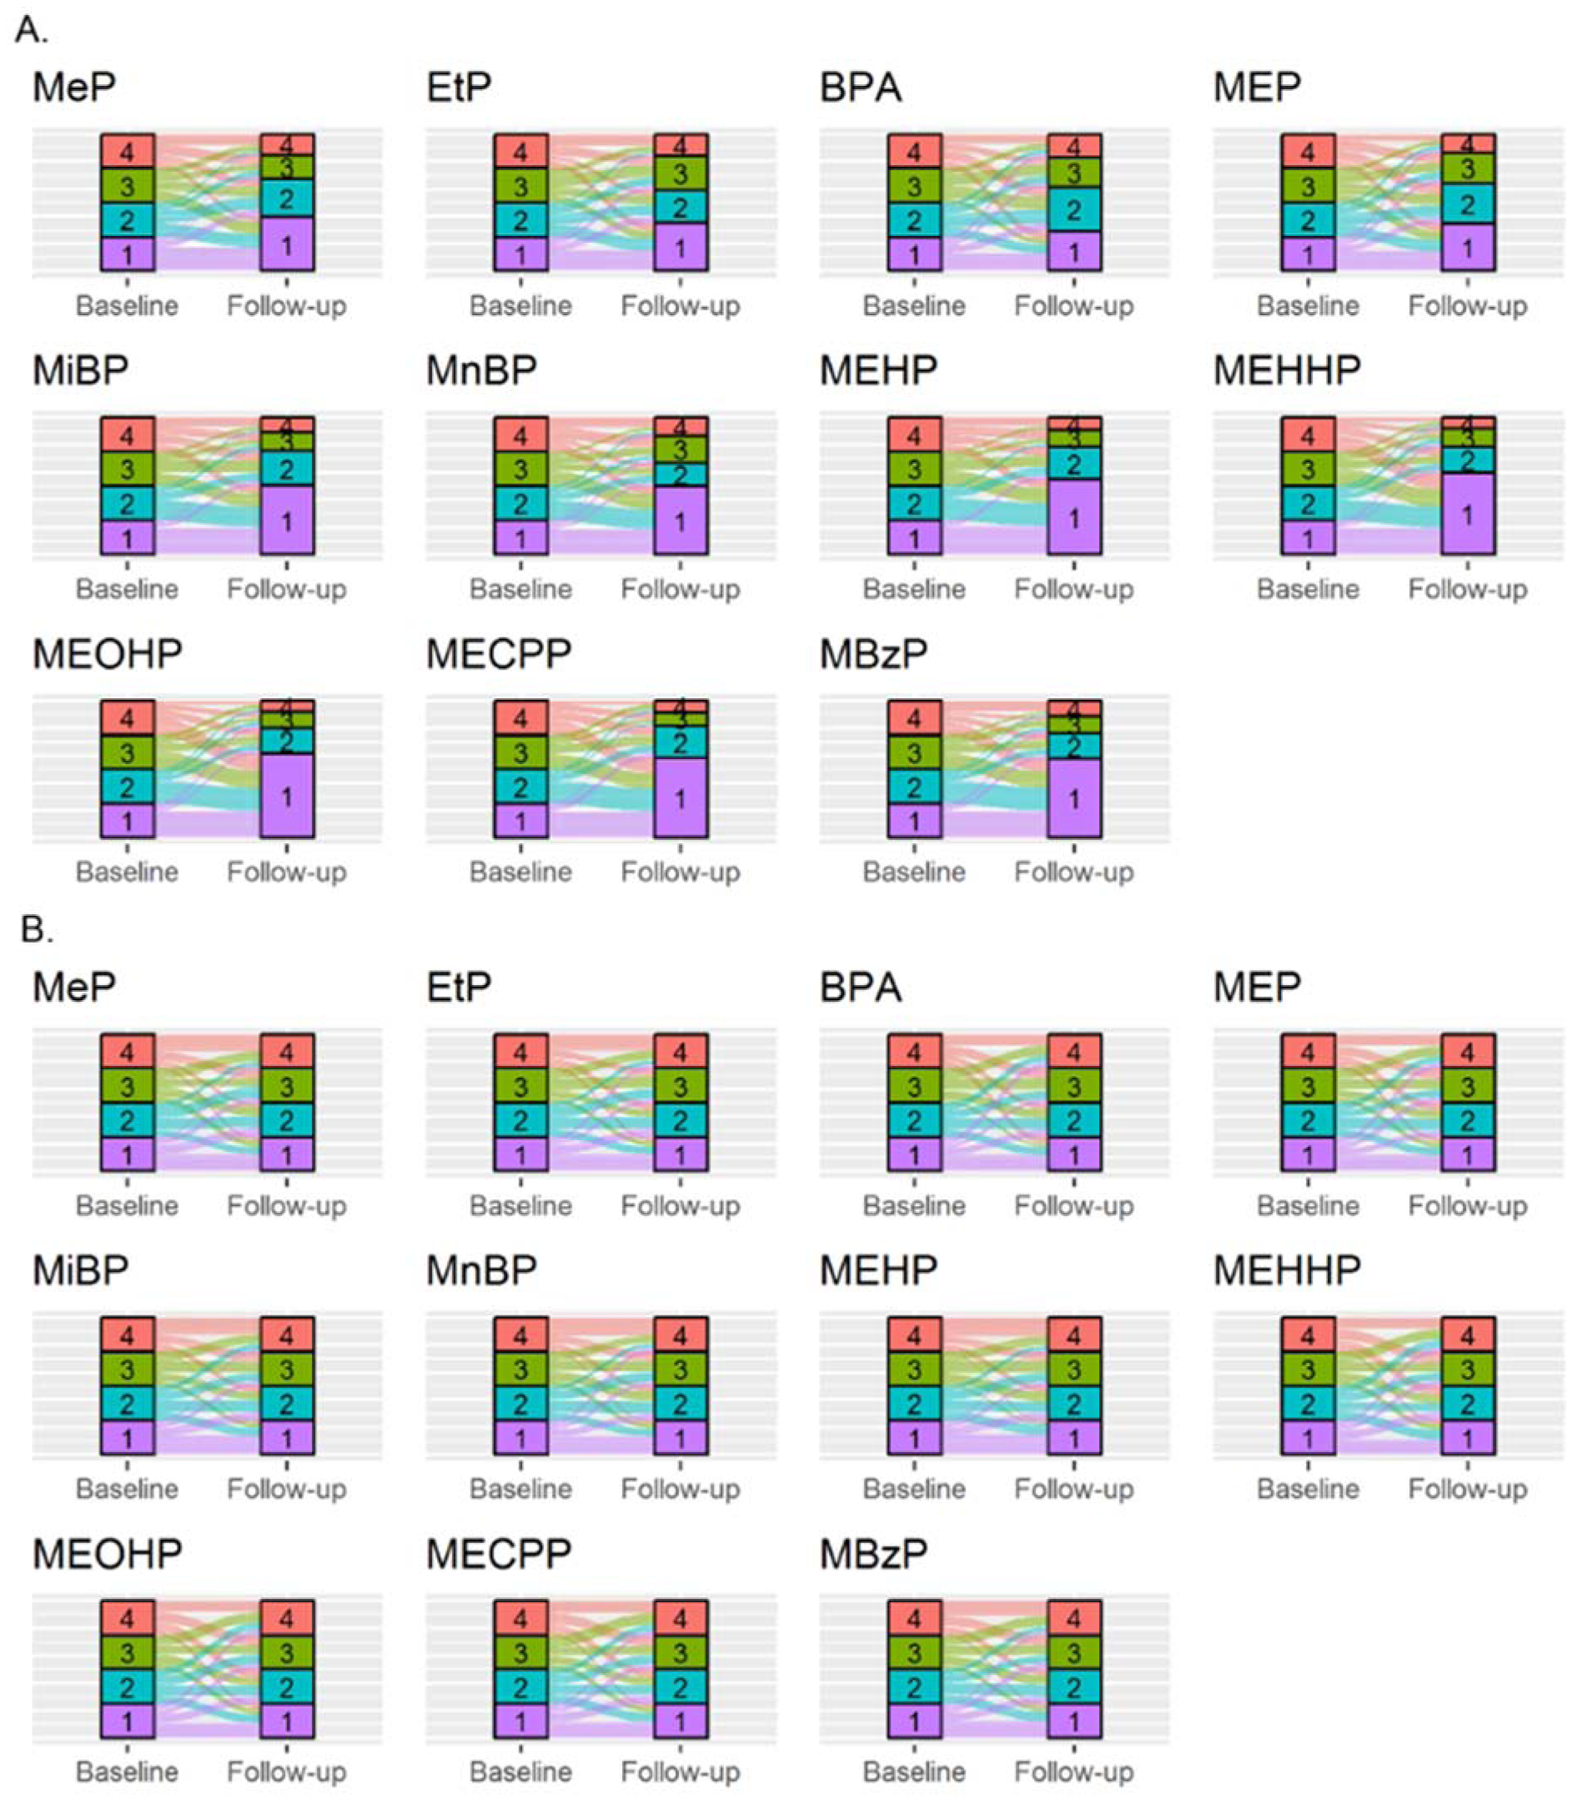
Figure 4.

Consistency of categorized endocrine disrupting chemicals.
A.) Endocrine disrupting chemical exposure groups categorized in quartiles based on baseline cut-off values. The sizes of the categories at follow-up show the proportion in which concentrations at follow-up would be categorized based on baseline exposure measurements. The observed size increase of the lowest category is in line with the decreasing trend in EDC exposures as depicted in Figure 1. B.) Endocrine disrupting chemical exposure groups categorized in quartiles based on the cut-off values at their respective timepoint, leading to an equal distribution of individuals over the quartiles. The coloured bands express the proportion of individuals which are categorized in that respective quartile at baseline that relocate to a category at follow-up. The category labelled “1” (purple) represents the lowest exposure category, whereas the “4” (red) represents the highest exposure quartile. Full names of EDC abbreviations are shown in Table 1.
