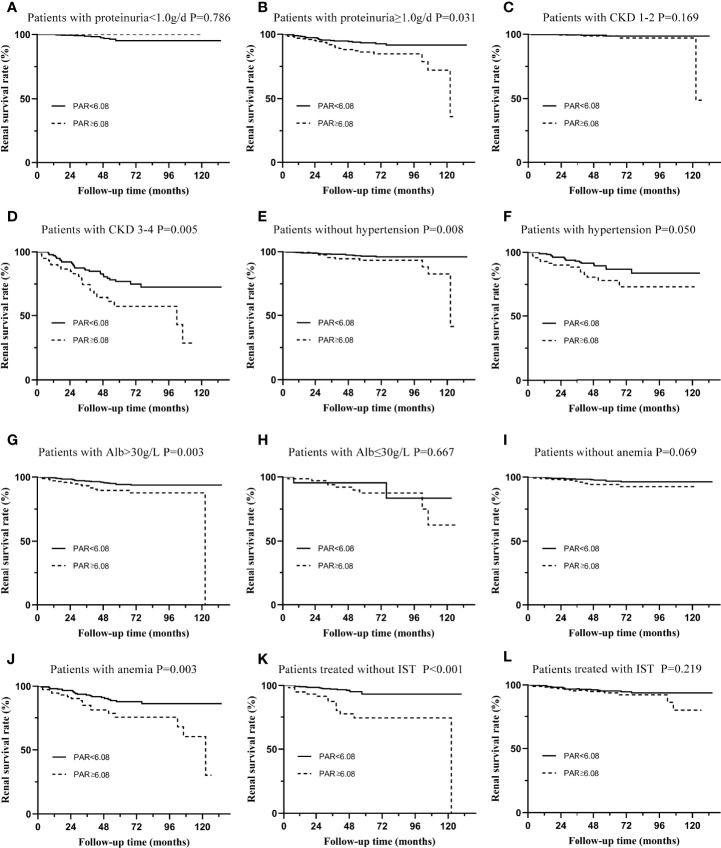
Figure 5.
Subgroup analysis of IgAN patients with different types of clinical manifestations. (A) The renal survival curve of patients with proteinuria≤1.0g/d in two groups separated by PAR. (B) The renal survival curve of patients with proteinuria ≥1.0g/d in two groups separated by PAR. (C) The renal survival curve of patients with CKD 1-2 in two groups separated by PAR. (D) The renal survival curve of patients with CKD 3-4 in two groups separated by PAR. (E) The renal survival curve of patients without hypertension in two groups separated by PAR. (F) The renal survival curve of patients with hypertension in two groups separated by PAR. (G) The renal survival curve of patients with Alb>30g/L in two groups separated by PAR. (H) The renal survival curve of patients with Alb≤30g/L in two groups separated by PAR. (I) The renal survival curve of patients without anemia in two groups separated by PAR. (J) The renal survival curve of patients with anemia in two groups separated by PAR. (K) The renal survival curve of patients treated without IST in two groups separated by PAR. (L) The renal survival curve of patients treated with IST in two groups separated by PAR.

